


IMPROVED COMPUTATIONAL PREDICTION OF FUNCTION
AND STRUCTURAL REPRESENTATION OF SELF-CLEAVING
RIBOZYMES WITH ENHANCED PARAMETER SELECTION
AND LIBRARY DESIGN
by
James D. Beck
A dissertation
submitted in partial fulfillment
of the requirements for the degree of
Doctor of Philosophy in Computing
Boise State University
December 2022
© 2022
James D. Beck
ALL RIGHTS RESERVED
BOISE STATE UNIVERSITY GRADUATE COLLEGE
DEFENSE COMMITTEE AND FINAL READING APPROVALS
of the thesis submitted by
James D. Beck
Thesis Title: Improved Computational Prediction of Function and Structural Rep resentation of Self-Cleaving Ribozymes with Enhanced Parameter Se lection and Library Design
Date of Final Oral Examination: 29 September 2022
The following individuals read and discussed the dissertation submitted by student James D. Beck, and they evaluated the student’s presentation and response to questions during the final oral examination. They found that the student passed the final oral examination.
Eric J. Hayden Ph.D. Chair, Supervisory Committee
Grady B. Wright Ph.D. Member, Supervisory Committee
Steven Cutchin Ph.D. Member, Supervisory Committee
The final reading approval of the dissertation was granted by Eric J. Hayden Ph.D., Chair of the Supervisory Committee. The dissertation was approved by the Graduate College
ACKNOWLEDGMENT
To Cindy,
All my thanks, appreciation, and love.
JB
ABSTRACT
Biomolecules could be engineered to solve many societal challenges, including disease diagnosis and treatment, environmental sustainability, and food security. However, our limited understanding of how mutational variants alter molecular structures and functional performance has constrained the potential of important technological advances, such as high-throughput sequencing and gene editing. Ribonuleic Acid (RNA) sequences are thought to play a central role within many of these challenges. Their continual discovery throughout all domains of life is evidence of their significant bio logical importance (Weinreb et al., 2016). The self-cleaving ribozyme is a class of non coding Ribonuleic Acid (ncRNA) that has been useful for relating sequence variants to structural features and their associated catalytic activities. Self-cleaving ribozymes possess tractable sequence spaces, perform easily identifiable catalytic functions, and have well documented structures. The determination of a self-cleaving ribozyme’s structure and catalytic activity within the laboratory is typically a slow and expensive process.
Most current explorations of structure and function come from these empirical processes. Computational approaches to the prediction of catalytic activity and structure are fast and inexpensive, but have failed both to achieve atomic accuracy or to correctly identify all base-pair interactions (Watkins et al., 2018). One prominent impediment to computational approaches is the lack of existing structural and functional data typically required by predictive models (Jumper et al., 2021). Using data from deep-mutational scanning experiments and high-throughput sequencing technology, it is possible to computationally map mutational variants to their observed catalytic activity for a range of self-cleaving ribozymes. The resulting map reveals important base-pairing relationships that, in turn, facilitate accurate predictions of higher-order variants. Using sequence data from three experimental replicates of five model self-cleaving ribozymes, I will identify and map all single and double mutation variants to their observed cleavage activity. These mappings will be used to identify structural features within each ribozyme. Next, I will show within a training tool how observed cleavage for multiple reaction times can be used to identify the catalytic rates of our model ribozymes. Finally, I will predict the functional activity for model ribozyme variants of various mutational orders using machine learning models trained only on functionally labeled sequence variants. Together, these three dissertation chapters represent the kind of analysis needed to further the implementation of more accurate structural and functional prediction algorithms.
TABLE OF CONTENTS
ACKNOWLEDGMENT . . . . . . . . . . . . . . . . . . . . . . . . . . . . . .
ABSTRACT . . . . . . . . . . . . . . . . . . . . . . . . . . . . . . . . . . . .
LIST OF FIGURES . . . . . . . . . . . . . . . . . . . . . . . . . . . . . . . .
LIST OF TABLES . . . . . . . . . . . . . . . . . . . . . . . . . . . . . . . . .
LIST OF ABBREVIATIONS . . . . . . . . . . . . . . . . . . . . . . . . . . .
1 INTRODUCTION . . . . . . . . . . . . . . . . . . . . . . . . . . . . . . .
1.1 Research Motivation . . . . . . . . . . . . . . . . . . . . . . . . . . .
1.2 Research Objectives. . . . . . . . . . . . . . . . . . . . . . . . . . . .
1.3 Self-Cleaving Ribozymes . . . . . . . . . . . . . . . . . . . . . . . . .
1.4 Experimental Data . . . . . . . . . . . . . . . . . . . . . . . . . . . .
1.5 Research Challenges . . . . . . . . . . . . . . . . . . . . . . . . . . .
1.6 Scientific Contribution . . . . . . . . . . . . . . . . . . . . . . . . . .
1.7 FutureDirections . . . . . . . . . . . . . . . . . . . . . . . . . . . . .
2 RNA SEQUENCE TO STRUCTURE ANALYSIS FROM COMPREHENSIVE PAIRWISE MUTAGENESIS OF MULTIPLE SELF-CLEAVING RI BOZYMES . . . . . . . . . . . . . . . . . . . . . . . . . . . . . . . . . .
2.1 Introduction . . . . . . . . . . . . . . . . . . . . . . . . . . . . . . . .
2.2 Result sand Discussion . . . . . . . . . . . . . . . . . . . . . . . . . .
2.2.1 Evaluation of read depth and mutational coverage . . . . . . .
2.2.2 Epistatic effects in paired nucleotide positions show stability dependent signatures. . . . . . . . . . . . . . . . . . . . . . . .
2.2.3 Catalytic residues do not have any high-activity mutants,and do not exhibit epistasis. . . . . . . . . . . . . . . . . . . . . .
2.2.4 Unpaired nucleotides show tertiary structure dependent mutational effects. . . . . . . . . . . . . . . . . . . . . . . . . . . .
2.2.5 Epistasis plots are an in formative approach to visualizing high through put activity data . . . . . . . . . . . . . . . . . . . . .
2.2.6 Conclusion. . . . . . . . . . . . . . . . . . . . . . . . . . . . .
2.3 Materials and Methods . . . . . . . . . . . . . . . . . . . . . . . . . .
2.3.1 Co-transcriptional self-cleavage assay . . . . . . . . . . . . . .
2.3.2 High-through put sequencing . . . . . . . . . . . . . . . . . . .
2.3.3 Sequencing data analysis . . . . . . . . . . . . . . . . . . . . .
2.3.4 Correlation of thermodynamic stability of paired regions and observed mutational effects. . . . . . . . . . . . . . . . . . . .
2.3.5 Acknowledgements . . . . . . . . . . . . . . . . . . . . . . . .
2.3.6 Competing Interests Statement . . . . . . . . . . . . . . . . .
2.3.7 Data Availability . . . . . . . . . . . . . . . . . . . . . . . . .
2.3.8 Supplementary Materials . . . . . . . . . . . . . . . . . . . . .
3 ANALYSIS OF CATALYTIC ACTIVITY FOR THE SELECTION OF TIME PARAMETERS FOR TWISTER SELF-CLEAVING RIBOZYMES . . .
4 PREDICTING HIGHER-ORDER MUTATIONAL EFFECTS IN AN RNA ENZYME BY MACHINE LEARNING OF HIGH-THROUGHPUT EXPERIMENTAL DATA . . . . . . . . . . . . . . . . . . . . . . . . . . . . . . .
4.1 Introduction . . . . . . . . . . . . . . . . . . . . . . . . . . . . . . . .
4.2 Results . . . . . . . . . . . . . . . . . . . . . . . . . . . . . . . . . . .
4.3 Discussion . . . . . . . . . . . . . . . . . . . . . . . . . . . . . . . . .
4.4 Materials and Methods . . . . . . . . . . . . . . . . . . . . . . . . . .
4.4.1 Ribozyme activity data. . . . . . . . . . . . . . . . . . . . . .
4.4.2 Ribozyme activity from sequence data . . . . . . . . . . . . .
4.4.3 Machine Learning . . . . . . . . . . . . . . . . . . . . . . . . .
4.4.4 Training and Test Data. . . . . . . . . . . . . . . . . . . . . .
4.4.5 Data Availability . . . . . . . . . . . . . . . . . . . . . . . . .
4.4.6 Author Contributions. . . . . . . . . . . . . . . . . . . . . . .
4.4.7 Funding . . . . . . . . . . . . . . . . . . . . . . . . . . . . . .
4.4.8 Acknowledgments . . . . . . . . . . . . . . . . . . . . . . . . .
4.4.9 Supplementary Materials . . . . . . . . . . . . . . . . . . . . .
REFERENCES . . . . . . . . . . . . . . . . . . . . . . . . . . . . . . . . . .
APPENDICES . . . . . . . . . . . . . . . . . . . . . . . . . . . . . . . . . . .
A EQUATIONS . . . . . . . . . . . . . . . . . . . . . . . . . . . . . . . . . .
LIST OF FIGURES
1.1 a) RNA polymerase transcribes Deoxyribose Nucleic Acid (DNA) into a single-stranded RNA sequence of nucleotides. b) Mature messenger Ribonuleic Acid (mRNA) are translated into proteins. non-coding Ribonuleic Acid (ncRNA) are RNA sequences that are not translated into proteins but instead fold into functionally active molecules. . . .
1.2 DNA’sdouble-stranded helix is formed by complementary base-pairing between nucleotides. In DNA, A pairs with T and G with C. RNA forms complex structures through complementary base-pairing between nucleotides along its single-strand. In RNA, uracil (U) replaces T to base-pair with adenine . . . . . . . . . . . . . . . . . . . . . . . . . .
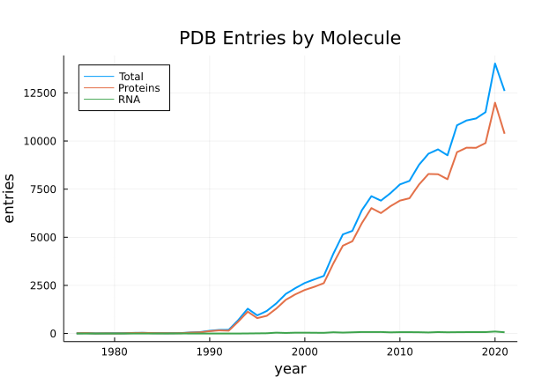
1.3 The number of characterized RNA molecules cataloged annually in the Protein Data Bank is far fewer than the number of proteins (Bermanet al., 2007; wwPDB consortium et al., 2019). . . . . . . . . . . . . .
1.4 Some RNAtranscripts are further translated into proteins while others remain RNA that possess functional capabilities (also, ncRNA). . . .
1.5 Sequence mutations cause structural changes that impact the fraction cleaved. Measuring this functional change in relationship to specific mutations indicates the positional importance to the catalytic reaction.
1.6 Catalytic rate (kobs) for all nine possible double mutations at position 1 and 2 of the twister ribozyme. Dark shades reflect higher catalytic rates. Lighter shades reflect lower catalytic rates. . . . . . . . . . . .
1.7 Relative fitness for all possible single and double mutations of the Twister self-cleaving ribozyme. Relative fitness normalizes the fraction cleaved for a specific variant to that of the naturally occurring variant. Dark shades reflect higher relative fitness. Lighter shades reflect lower relative fitness. . . . . . . . . . . . . . . . . . . . . . . .
1.8 Relative activity of HDV ribozyme using restricted counting algorithm (left) and deep counting algorithm (right). Insufficient counts on the left hide structural features. . . . . . . . . . . . . . . . . . . . . . . .
1.9 Single nucleotide mutations (C in position 1 or G in position 2) break base-pairing. A double mutation consisting of both single mutations retain base-pairing. Epistasis measures the non-linear result of the double mutant in relation to the component single mutations. . . . .
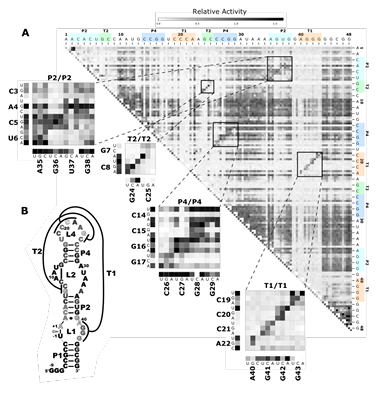
2.1 Effects of mutations and pairwise epistasis in a CPEB3 ribozyme. A) Relative activity heatmap depicting all possible pairwise effects of mutations on the cleavage activity of a mammalian CPEB3 ribozyme. Base-paired regions P1, P2, P3, P4, and T1 are highlighted and color coordinated along the axes, and surrounded by black squares within the heatmap. Pairwise epistasis interactions observed for each paired regions are each shown as expanded insets for easy identification of the specific epistatic effects measured for each pair of mutations. Instances of positive epistasis are shaded blue, and negative epistasis is shaded red, with higher color intensity indicating a greater magnitude of epistasis. Catalytic residues are indicated by stars along the axes. B)
Secondary structure of the CPEB3 ribozyme used in this study. Each nucleotide is shaded to indicate the average relative cleavage activity of all single mutations at that position. C) Histogram showing the distributions of epistasis in the paired regions of CPEB3. The distribution for double mutants within a paired region that are not involved in a base-pair is shown in grey, and the distribution for nucleotides involved in a base-pair is shown in blue. . . . . . . . . . . . . . . . . . . . . .
2.2 Comprehensive pairwise epistasis landscape for a HDV self-cleaving ribozyme. A) Relative activity heatmap depicting all possible pair wise effects of mutations on the cleavage activity of an HDV ribozyme. Base-paired regions P1, P2, P3, P4, and T1 are highlighted and color coordinated along the axes, and surrounded by black squares within the heatmap. Pairwise epistasis interactions observed for each paired regions are each shown as expanded insets for easy identification of the specific epistatic effects measured for each pair of mutations. In stances of positive epistasis are shaded blue, and negative epistasis is shaded red, with higher color intensity indicating a greater magnitude of epistasis. Catalytic residues are indicated by stars along the axes. B) Secondary structure of the HDV ribozyme used in this study. Each nucleotide is shaded to indicate the average relative cleavage activity of all single mutations at that position. C) Histogram showing the distributions of epistasis in the paired regions of HDV. The distribution for double mutants within a paired region that are not involved in a base-pair is shown in grey, and the distribution for nucleotides involved in a base-pair is shown in blue. . . . . . . . . . . . . . . . . . . . . .
2.3 Comprehensive pairwise epistasis landscape for a hammerhead self cleaving ribozyme. A) Relative activity heatmap depicting all possible pairwise effects of mutations on the cleavage activity of a hammer head ribozyme. Base-paired regions P1, and P2 are highlighted and color coordinated along the axes, and surrounded by black squares within the heatmap. Pairwise epistasis interactions observed for each paired region are each shown as expanded insets for easy identification of the specific epistatic effects measured for each pair of mutations. Instances of positive epistasis are shaded blue, and negative epistasis is shaded red, with higher color intensity indicating a greater magnitude of epistasis. Catalytic residues are indicated by stars along theaxes. B) Secondary structure of the hammerhead ribozyme used in this study. Each nucleotide is shaded to indicate the average relative cleavage activity of all single mutations at that position. C) Histogram showing the distributions of epistasis in the paired regions of hammer head. The distribution for double mutants within a paired region that are not involved in a base-pair is shown in grey, and the distribution for nucleotides involved in a base-pair is shown in blue. . . . . . . . .
2.4 Comprehensive pairwise epistasis landscape for a twister self-cleaving ribozyme. A) Relative activity heatmap depicting all possible pairwise effects of mutations on the cleavage activity of a twister ribozyme. Base-paired regions P2, P4, T1, and T2 are highlighted and color co ordinated along the axes, and surrounded by black squares within the heatmap. Pairwise epistasis interactions observed for each paired region are each shown as expanded insets for easy identification of the specific epistatic effects measured for each pair of mutations. Instances of positive epistasis are shaded blue, and negative epistasis is shaded red, with higher color intensity indicating a greater magnitude of epis tasis. Catalytic residues are indicated by stars along the axes. B) Secondary structure of the twister ribozyme used in this study. Each nucleotide is shaded to indicate the average relative cleavage activity of all single mutations at that position. C) Histogram showing the dis tributions of epistasis in the paired regions of twister. The distribution for double mutants within a paired region that are not involved in a base-pair is shown in grey, and the distribution for nucleotides involved in a base-pair is shown in blue. . . . . . . . . . . . . . . . . . . . . .
2.5 Comprehensive pairwise epistasis landscape for a hairpin self-cleaving ribozyme. A) Relative activity heatmap depicting all possible pairwise effects of mutations on the cleavage activity of a hairpin ribozyme. Base-paired regions P1, P2, and P3 are highlighted and color coordinated along the axes, and surrounded by black squares within the heatmap. Pairwise epistasis interactions observed for each paired re gion are each shown as expanded insets for easy identification of the specific epistatic effects measured for each pair of mutations. Instances of positive epistasis are shaded blue, and negative epistasis is shaded red, with higher color intensity indicating a greater magnitude of epis tasis. Catalytic residues are indicated by stars along the axes. B) Secondary structure of the hairpin ribozyme used in this study. Each nucleotide is shaded to indicate the average relative cleavage activity of all single mutations at that position. C) Histogram showing the distributions of epistasis in the paired regions of hairpin. The distribution for double mutants within a paired region that are not involved in a base-pair is shown in grey, and the distribution for nucleotides involved in a base-pair is shown in blue. D) Violin plots showing the distributions of epistasis in all terminal stem loops across all five ribozymes, and epistasis observed within loop A, loop B, and between loop A and loop B in the hairpin ribozyme. . . . . . . . . . . . . . . . . . . . . .
2.6 Histogram of the distributions of read counts (read depth) for the single and double mutants matching to each ribozyme analyzed in this study (HDV, CPEB3, hammerhead, hairpin, twister . . . . . . . . . . . . .
2.7 Distributions for epistasis values seen on and off anti-diagonal in the epistasis heatmaps. The distributions of epistasis values along the anti-diagonal corresponding to double mutations between nucleotides involved in a Watson-Crick base-pair are shown in blue, and the epistasis values seen off diagonal are shown in gray. . . . . . . . . . . . .
2.8 Relationship between the Gibbs free energy (∆G) of each base paired region belonging to the hairpin, hammerhead, CPEB3, HDV, and twister ribozymes, and the median relative activity of all single mu tants within each base paired region (Pearson Correlation =-0.53). .
2.9 Distributions of relative self-cleavage activity observed for sequences containing mutations to the catalytic nucleotides in the CPEB3, HDV, twister, hairpin, and hammerhead ribozymes. . . . . . . . . . . . . .
2.10 Distribution of pairwise epistasis observed between the loops of P1 and P2 in the hammerhead ribozyme. . . . . . . . . . . . . . . . . . . . .
4.1 CPEB3 Ribozyme Structure (A), Relative Activity of Single and Double Mutants (B), Pairwise Epistasis (C), and Fitness Landscape (D) .
4.2 Prediction of of CPEB3 variants with 3 or more mutations using models trained on two or fewer mutation variants . . . . . . . . . . . . . . .
4.3 Prediction of of CPEB3 variants using LSTM and Random Forest Ma chine Learning Models . . . . . . . . . . . . . . . . . . . . . . . . . .
4.4 Prediction of of CPEB3 Variants on Reduced Size Training Sets . . .
4.5 Histogram of CPEB3 variant counts for single (left) and double (right) mutants. Mean, minimum and maximum values for each distribution are indicated. . . . . . . . . . . . . . . . . . . . . . . . . . . . . . . .
4.6 Three-mutation sequence activity predictions. Scatter plots comparing fraction cleaved values measured from experiments (observed) to those predicted by models (predict) trained by either random forest (blue) or the LSTM approach (orange). Each scatter plot shows the predictions from a different training data set. The training data contained sequences with up to the number of mutations in the title (Train N). For example, ‘Train 5’ indicates that the model was trained using data for sequences containing 1,2,3,4, and 5 mutations. The line indicates
unity, not a fit to the data. . . . . . . . . . . . . . . . . . . . . . . . .
4.7 Predicting the activity of sequences with four mutations. (see Supp. Fig. 2 for details) . . . . . . . . . . . . . . . . . . . . . . . . . . . . .
4.8 Predicting the activity of sequences with five mutations. (see Supp. Fig. 2 for details) . . . . . . . . . . . . . . . . . . . . . . . . . . . . .
4.9 Predicting the activity of sequences with six mutations. (see Supp. Fig. 2 for details) . . . . . . . . . . . . . . . . . . . . . . . . . . . . .
4.10 Predicting the activity of sequences with seven mutations. (see Supp. Fig. 2 for details) . . . . . . . . . . . . . . . . . . . . . . . . . . . . .
4.11 Predicting the activity of sequences with eight mutations. (see Supp. Fig. 2 for details) . . . . . . . . . . . . . . . . . . . . . . . . . . . . .
4.12 Predicting the activity of sequences with nine mutations. (see Supp. Fig. 2 for details) . . . . . . . . . . . . . . . . . . . . . . . . . . . . .
4.13 Predicting the activity of sequences with ten mutations. (see Supp. Fig. 2 for details) . . . . . . . . . . . . . . . . . . . . . . . . . . . . .
4.14 Predicting the activity of sequences with eleven mutations. (see Supp. Fig. 2 for details) . . . . . . . . . . . . . . . . . . . . . . . . . . . . .
4.15 Predicting the activity of sequences with twelve mutations. (see Supp. Fig. 2 for details) . . . . . . . . . . . . . . . . . . . . . . . . . . . . .
4.16 Line plots showing the mean square error (MSE) of predicted cleavage activity values obtained from random forest (blue) and LSTM with random forest (orange) machine learning models trained on data with incrementally increasing numbers of mutations shown along the x-axis. Each plot shows the MSE for predictions obtained for sequences con taining the number of mutations indicated by the plot title. . . . . . .
4.17 Line plots showing the Pearson correlation values of predicted cleavage activity obtained from random forest (blue) and LSTM with ran dom forest (orange) machine learning models trained on data with in crementally increasing numbers of mutations shown along the x-axis. Each plot shows the Pearson correlation for predictions obtained for sequences containing the number of mutations indicated by the plot title. . . . . . . . . . . . . . . . . . . . . . . . . . . . . . . . . . . . .
4.18 Bench marking against several ML approaches. Line plots showing the Pearson correlation values of predicted cleavage activity obtained from random forest (blue), LSTM with random forest (orange), linear regression (green) and multilayer perceptron regressor (red) machine learning models trained on data with incrementally increasing numbers of mutations shown along the x-axis. Each plot shows the Pearson correlation for predictions obtained for sequences containing the number of mutations indicated by the plot title. . . . . . . . . . . . . . . . . . .
4.19 Violin plots showing the distribution of cleavage rates observed in the test data (orange) and the total data set for a given mutation (blue). The distributions are shown separately for each data set containing increasing numbers of mutations, from 3 to 12. . . . . . . . . . . . . .
4.20 Summary of important features extracted from random forest models. A-B) Bar graphs of feature importance when training with up to five mutations. Each feature represents a specific nucleotide at a specific location, as indicated by the X-axis label (position), and color (nucleotide identity). Positions 1-35 are shown in (A), and positions 36-69 are shown in (B). The height of the bar indicates the relative importance. C) Table ranking the top ten important features extracted from random forest models trained with increasing numbers of mutations. Nucleotides discussed in the main text are highlighted. . . . . . . . .
4.21 Crystal structure of an H D V ribozyme (PDB 3NKB) showing the CPEB3 analogous positions representing the top ten important fea tures identified in our random forest models. The feature importance depicted was extracted from the random forest model trained on CPEB3 data including up to 5 mutations. The nucleotides identified as the top ten important features are shaded in orange, the catalytic nucleotide is shaded green (C57/75), and the catalytic M g 2+ ion is depicted as a blue sphere. . . . . . . . . . . . . . . . . . . . . . . . .
LIST OF TABLES
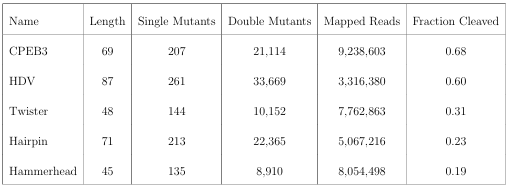
2.1 Summary of the lengths of each self-cleaving ribozyme used in this study, and the number of single and double mutants whose cleavage activity was analyzed. . . . . . . . . . . . . . . . . . . . . . . . . . .
2.2 Oligonucleotides used in this study. * DNA template for in vitro transcriptions. ** Phase template switching oligo. Bolded nucleotides indicate positions synthesized using doped phosphoramidites (3% mutation
rate) . . . . . . . . . . . . . . . . . . . . . . . . . . . . . . . . . . . .
4.1 Counts of sequences in training and testing data sets. . . . . . . . . .
4.2 Table comparing Pearson and Spear man correlation metrics for reduced training sets containing sequences with up to 5 mutations predicting sequences with 7 mutations. Both Pearson and Spear man correlations show similar, limited reductions in correlation as training set size is reduced. . . . . . . . . . . . . . . . . . . . . . . . . . . . . . .
4.3 Table comparing Pearson and Spear man correlation metrics for training set containing sequences with up to 2 mutations predicting sequences with 3 to 11 mutations using the L S TM with Random Forest
and the Random Forest models. Both Pearson and Spear man cor relations show similar reductions in correlation as predictive distance grows. . . . . . . . . . . . . . . . . . . . . . . . . . . . . . . . . . . .
LIST OF ABBREVIATIONS
cDNA
complementary Deoxyribose Nucleic Acid
CPEB3
Cytoplasmic Polyadenylation Element Binding Protein 3
DNA
Deoxyribose Nucleic Acid
FLASh
Fast Length Adjustment of Sort reads
HDV
Hepatitis D Virus Ribonuleic Acid
mRNA
messenger Ribonuleic Acid
ncRNA
non-coding Ribonuleic Acid
PCR
polymerase chain reaction
RNA
Ribonuleic Acid
rRNA
ribosomal Ribonuleic Acid
ssDNA
single-stranded Deoxyribose Nucleic Acid
tRNA
transfer Ribonuleic Acid
CHAPTER 1
INTRODUCTION
1.1 Research Motivation
Continued advancements in DNA sequencing technology have caused a revolution in molecular biology. The wide availability of high-throughput sequencing means that millions of genetic observations are commonly available to researchers (Levy & Boone, 2019). The genetic sequencing data contains clues to the causes of rare medical conditions, desirable crop characteristics, and the essential features of environmental habitats. When combined with modern methods for DNA synthesis and gene editing, these technologies form a bio-engineering toolkit capable of identifying genetic opportunities and implementing desired modifications (Gupta & Shukla, 2017; Mao et al., 2019; Bak et al., 2018). Standing in the way of the toolkit’s full utility is an uncharted molecular complexity that pervades even the simplest of organisms. New discoveries, however, continue to reveal and explain this complexity and within each discovery comes the potential to engineer molecules that eliminate disease, improve food security, or reduce environmental damage.
All living organisms are distinguished by a unique genetic sequence that encodes their physical features and processes. DNA stores this genetic encoding within a polymer sequence composed from just four nucleotide monomers (guanine (G), cytosine (C), adenine (A), and thymine (T)). Base-pairing between DNA’s two complemen
tary polymer strands gives DNA a stable storage structure and its familiar double helical form. The DNA sequence is copied into molecularly similar, single stranded RNA sequences, in a process termed transcription. These RNA sequences serve as intermediaries between DNA and translated amino-acid sequences, called proteins (Figure 1.1). Proteins are commonly known for their prominent role in life’s essential biological processes. But more recently, a class of untranslated RNA molecules called non-coding Ribonuleic Acid (ncRNA) are also being found to play substantial functional roles. Combined, proteins and ncRNAs provide many of the biological functions necessary for life.

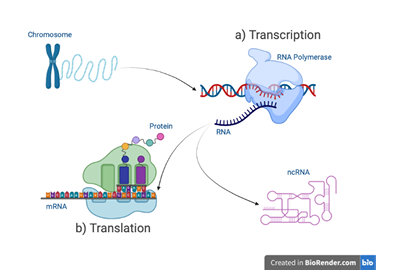
RNA sequence of nucleotides. b) Mature mRNA are translated into pro
teins. non-coding Ribonuleic Acid (ncRNA) are RNA sequences that
are not translated into proteins but instead fold into functionally active molecules.
Proteins are polymeric sequences composed from twenty distinct amino acid monomers. These protein sequences fold into complex, three-dimensional structures, each possessing some functional capability. The protein’s physical structure is primarily determined by its sequence and the inter-molecular hydrogen bonds that stabilize its folds. Millions of distinct proteins have been identified. ncRNA share characteristics of both DNA and protein molecules. Like DNA, ncRNA sequences are composed from a similar set of four nucleotide monomers and form structures as a consequence of complementary base-pairing (Figure 1.2). Like proteins, ncRNA spontaneously fold into complex, three-dimensional structures that perform an array of cellular functions. And, also like proteins, mutations to ncRNA sequences can alter their structure and functional abilities. However, unlike proteins, many ncRNAs are still being identified and, as a result, far fewer active structures are known (Figure 1.3).

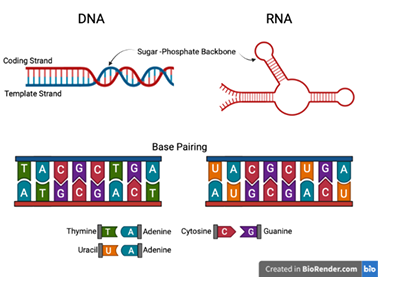
base-pairing between nucleotides. In DNA, A pairs with T and G with
C. RNA forms complex structures through complementary base pairing
between nucleotides along its single-strand. In RNA, uracil (U) replaces T to base-pair with adenine

The ncRNA sequences that have been characterized clearly demonstrate their importance to gene expression. For example, transfer Ribonuleic Acid (tRNA) is a 76-90 nucleotide ncRNA that physically links an mRNA molecule to a protein’s chain of amino acids during translation (Figure 1.1b). The RNA components of ribosomal Ribonuleic Acid (rRNA) also participates in translation by carrying out protein synthesis. Ribozymes are another type of ncRNA molecule that catalyzes biochemical reactions such as the ligation and cleavage activities used in gene expression (Fedor & Williamson, 2005). ncRNA are common genetic actors, representing a large majority of a cell’s pool of RNA (Figure 1.4).

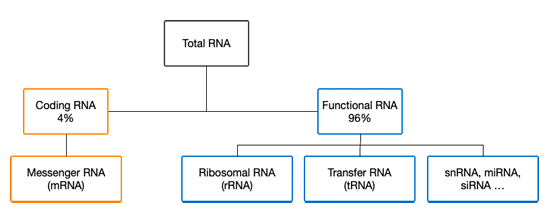
teins while others remain RNA that possess functional capabilities (also, ncRNA).
Because of their roles in gene expression, the lack of data characterizing their active structures, and a limited understanding of how mutations affect these structures, ncRNA represent a significant unmet opportunity to explain biological complexity. A well developed understanding of how ncRNA can be used to regulate an organism’s genome could be a critical precursor to achieving a wide array of bio-engineering objectives. This dissertation seeks to contribute tools, methods, and data to the ex ploration of how ncRNA sequence variants relate to structural features and functional activity. My hope is that these contributions provide useful insight into the complexities of ncRNA and are helpful to those seeking to incorporate their functional abilities into bio-engineered molecules.
1.2 Research Objectives
Many valuable contributions to our understanding of how mutations affect active structures are accomplished in the laboratory using slow and expensive experimental processes. Consequently, considerable interest has developed in the application of computational algorithms to speed up discovery by supplementing or replacing experimental processes. Recently, algorithms have successfully predicted previously unknown protein structures from sequences using machine learning models (Jumper et al., 2021). However, structural predictions of ncRNA has been far less successful and the functional consequences of ncRNA mutations remain an unresolved area of study.
This dissertation focuses on the implementation of computational approaches to reveal relationships between ncRNA sequences and their active structures, using ribozymes as model systems. Ribozymes are ncRNA molecules that catalyze chemical reactions. Self-cleaving ribozymes are a common and naturally occurring class of ri bozymes that catalyze a reaction which breaks the chemical bonds at a specific site along their phosphodiester backbone. Sequence mutations within a self-cleaving ri bozyme can affect base-pair relationships, resulting in structural changes that affect its catalytic rate.
In Chapter Two, we explore the effects of all possible single and double mutational variants found within experimental replicates of five, self-cleaving ribozymes. A variety of different cleavage metrics for each of these variants is position ally mapped to reveal structural relationships within the sequences. This extensive mapping represents a valuable contribution to a currently limited pool of ncRNA data. I was involved in conceptualizing the project, managed data, performed all computational work for formal analysis and visualization, and reviewed and edited the published manuscript. In Chapter Three, we use cleavage counts to calculate the catalytic rates for all single and double mutation variants of the Twister self-cleaving ribozyme. Using observed data at multiple time periods, we fit an exponential decay function to reveal activity across a larger dynamic range. This algorithm is incorpo rated into a documented set of training materials for use by future lab members. I was involved in conceptualizing the project, managed data, performed computational work for formal analysis and visualization, and wrote the Jupyter book. In Chapter Four, we use cleavage activity data from two Cytoplasmic Polyadenylation Element Binding Protein 3 (CPEB3) self-cleaving ribozyme libraries to predict the cleavage activity of higher-order mutational variants using a variety of machine learning methods. Such predictions are a critical tool for identifying active ncRNA structures within the immensity of possible mutational variants. I was involved in conceptual izing the project, managed data, performed computational work for formal analysis and visualization, and reviewed and edited the published manuscript. Together, these chapters contribute tools and methods for assessing the impact of mutations on active ncRNA structures and important mutational data for five, self-cleaving ribozymes to the research community.
1.3 Self-Cleaving Ribozymes
Self-cleaving ribozymes are being used to engineer biological systems. In addition to their natural roles, self-cleaving ribozymes have been synthetically incorporated into molecules designed to control gene expression. These engineered systems can adjust expression by affecting, positively or negatively, the ribozyme’s cleavage rate. This is accomplished by introducing mutations to the ribozyme’s sequence that modifies its structure, resulting in a changed catalytic rate. Because of this direct connection between sequence, structure, and function, self-cleaving ribozymes are a particularly interesting model system for bio-engineering.
Self-cleaving ribozymes also have several physical properties that are well-suited for exploring the connections between sequences, structures, and functional activities. First, there exists a variety of self-cleaving ribozymes possessing known structures from which base-pairs, tertiary contacts, and catalytically involved nucleotides have been identified. Second, each typically has a sequence length that is sufficiently small enough to easily synthesize mutational variants. Third, each cleaves spontaneously upon achieving a folded conformation and requires no other molecules to catalyze their reaction. And fourth, each cleaves during the transcription reaction. Upon the reaction’s conclusion, a fraction cleaved can be calculated for each ribozyme variant by counting the number of times it exists in either a cleaved or uncleaved state (Equation A.2).
The fraction cleaved for each sequence variant can be used to relate positional mutations to catalytic effects. Mutations that impact structurally or chemically important nucleobases are indicated by changes in their activity (Figure 1.5). Mutations that maintain or improve upon active structures retain a high fraction cleaved. Mutations that disrupt active structures, on the other hand, cause a lower fraction cleaved. Mutations that reduce fraction cleaved typically break base pairs within critical structures or alter required nucleotides at catalytically important positions.

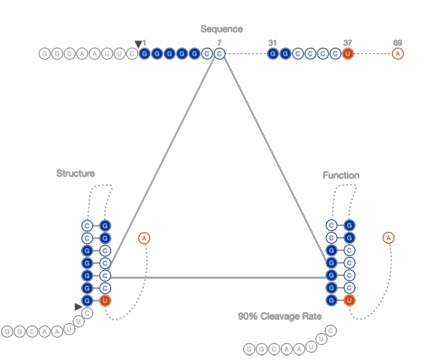
fraction cleaved. Measuring this functional change in relationship to spe
cific mutations indicates the positional importance to the catalytic reac tion.
The observed fraction cleaved is also time dependent. Self-cleaving ribozyme variants that require more time to fold into an active state will cleave given sufficient time. Those variants that don’t cause structural defects will fold more quickly into an active state than those that do. A longer reaction time will cause variants to skew towards a higher fraction. If all mutations produce relatively high activity levels, then structural changes caused by mutations will be difficult to discern. Consequently, the selected reaction time can limit the visibility of structure within a sequence.
This dissertation uses a heatmap representation to examine mutational effects. The combined affects of mutations can be explored by their positions within the sequence to locate functionally important structures. For example, Figure 1.6 displays the catalytic rate (kobs) for all possible mutations at position one and two of the Twister self-cleaving ribozyme sequence. A sequence possessing two mutations can take on any one of nine (i.e., 32) possible nucleotide variants. Within a three-by-three grid, each individual pixel shows how a different mutational combination affects its observed cleavage rate. Obvious differences can be seen in how specific mutations are tolerated at these positions.

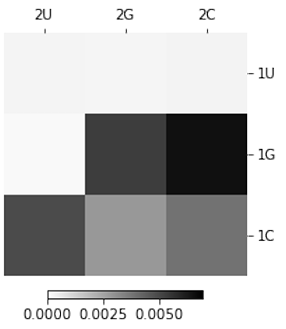
at position 1 and 2 of the twister ribozyme. Dark shades reflect higher
catalytic rates. Lighter shades reflect lower catalytic rates.
This same technique can be used to evaluate all possible single and double mutations for an entire ribozyme. Figure 1.7 shows the fraction cleaved for all single and double mutations within the Twister ribozyme sequence. Here, adjacent three by-three grids on any anti-diagonal represent contiguous mutational combinations occurring throughout the sequence.

the Twister self-cleaving ribozyme. Relative fitness normalizes the fraction
cleaved for a specific variant to that of the naturally occurring variant.
Dark shades reflect higher relative fitness. Lighter shades reflect lower relative fitness.
1.4 Experimental Data
This dissertation utilizes extensive experimental data that has been recently produced by our lab. Experiments in the lab have produced many copies of every possible single and double mutation for the CPEB3, Hepatitis D Virus Ribonuleic Acid (HDV), Hairpin, Hammerhead, and Twister self-cleaving ribozymes. This was done by first synthesizing DNA templates for each ribozyme using 97% of the wildtype nucleotides and 1% of each of the remaining nucleotide alternatives, yielding a large array of mutated variants. The low probability of an incorrect base ensures that most sequences contain only one or two incorrect bases and that all possible single and double mutations were created. To evaluate the activity of all the single and double mutant variants simultaneously, the mutated DNA was transcribed into RNA. During this transcription, the RNA molecules produced had the opportunity to self-cleave. Be cause the transcription, and ribozyme cleaving was stopped at thirty minutes, all
sequence variants had the same opportunity to self-cleave. The RNA was converted back to DNAfor sequencing through a process called reverse-transcription polymerase chain reaction (PCR).
The resulting DNA was sent for sequencing on an Illumina HiSeq 4000. On this platform, the DNA sequences are attached to a flow cell were their individual sequence monomers are determined by measuring the emission wavelength of complementary fluorescent-tagged nucleotides. This process occurs at both ends of the sequence so that we obtain a pair of reads starting from each side of the ribozyme. The sequencing output is stored in two FastQ files, each containing all the replicate ribozyme’s reads from one side of the sequence. Each replicate ribozyme’s two FastQ files are then merged using a software application called Fast Length Adjustment of Sort reads (FLASh) that identifies overlapping sequence segments and combines sequences possessing these overlaps into a single ribozyme sequence. The joined ribozyme files, also in a FastQ file format, are then surveyed for mutational variants and cleavage status. By aggregating the counts of cleaved and uncleaved sequences of a particular mutational variant, each variant’s observed fraction cleaved is determined(Equation A.2). This process of identifying the functional activity of numerous sequenced variants is known as ”deep mutational scanning”.
1.5 Research Challenges
The precision of an observed cleavage rate is dependent, in part, on whether the experimental data has a sufficient number of variant copies from which a fraction cleaved can be determined- a limitation that commonly arises when counting bi nary outcomes. Because structure is revealed by differences in the observed cleavage rates of positionally adjacent mutations, low variant counts restrict the appearance of structural details (Figure 1.8). Consequently, variant search algorithms should ro bustly identify mutated sequences. The more identified copies per variant, the more confidence we can have in the precision of our observed cleavage activity.

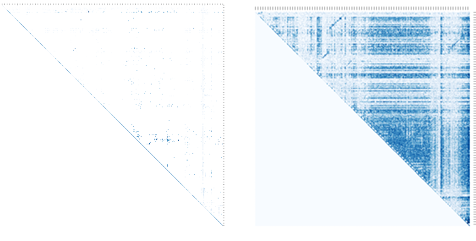
algorithm (left) and deep counting algorithm (right). Insufficient counts
on the left hide structural features.
While too few variant copies will limit our ability to identify structure, the extraor- dinarily large number of possible mutational variants limits our ability to explore all mutational effects on structure. Each mutated sequence can be thought of as member of a sequence space containing a set of mutational possibilities. A sequence containing n nucleotides has 4n possible sequences with n k 3 k possible combinations of k mutations of the naturally occurring sequence (Equation A.1). As a consequence of this exponential growth, even moderately sized ribozymes have a sequence space that can not be completely assessed. For example, the 69-nucleotide CPEB3 sequence has 3.4841 possible variants with 207 single mutants, 21,114 double mutants, and 1, 414,638 triple mutants.
The computational and experimental power necessary to comprehensively report function for most higher-order variants is currently unfeasible. Because of this, only a relatively small portion of any sequence space will be available to assess structural and functional features. Consequently, the sequence space elements that provide reliable explanatory power should be selected. One obvious sequence space choice is that which includes all single and double order variants. The production of all double and single-order variants for each ribozyme in sufficient quantity to accurately determine each variants cleaved rate is experimentally achievable. The consequences of single and double mutations on base pairing is well understood. Single mutations break base-pairs and double mutations have the potential to restore base-pairs (e.g., U-A replaced with a G-C). Double mutation variants can further be compared to their single mutation components to identify positive or negative epistasis- a result where the activity of two individual single mutations doesn’t produce the expected additive activity of the combined double mutation (Figure 1.9). The sequence space of all single and double-order vari ants, therefore, strikes an acceptable balance. The space is manageably sized and has an explanatory power that reveals the important base pair relationships that are fundamental to molecular structure. But, this limited portion of the sequence space may not reflect the full complexity underlying the tightly compacted ncRNA structures and, therefore, may be unable to accurately predict the activity associated with higher-order mutations.

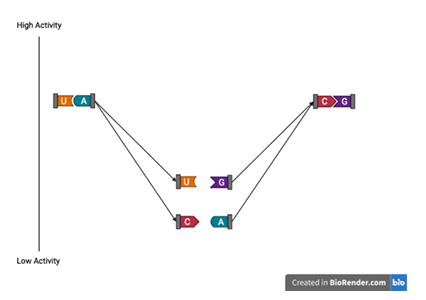
break base-pairing. A double mutation consisting of both single mutations
retain base-pairing. Epistasis measures the non-linear result of the double
mutant in relation to the component single mutations.
The full complexity of ncRNA sequence space involves base-pair arrangements that can’t be understood by solely evaluating single and double mutational variants. While the building of higher-order mutants from single and double mutants is appealing, epistatic affects become difficult to untangle when involving large numbers of mutations. Additionally, higher-order mutations have more opportunities to break base pairs and, as a result, are more functionally restricted. For this reason, some additions to the mutational diversity of sequence space in the form of active, higher order variants may be necessary for predictive models to incorporate the complexity of effective alternatives.
Models that have successfully predicted protein structures rely on such diverse, structural databases (Jumper et al., 2021). These databases serve to guide predictions toward structures commonly supported by nature. And because ncRNA share important similarities with proteins, there is reason to believe that similar methods for predicting ncRNA structures and functional rates would also require such a large, diverse database ncRNA structures. Unfortunately, such ncRNA databases are currently insufficient (Watkins et al., 2018) to cover the enormous array of possible unique, compact RNA structures thought to exist in nature (Rother et al., 2011; Chang et al., 2013; Geisler & Coller, 2013; Huppertz et al., 2022).
These challenges reflect the relatively early state of ncRNA research. We do not currently have available wide explorations of ncRNA sequence space from which we can asses structure and function. We lack libraries containing all the unique conformations from which we can predict ncRNA structures. Methods for relating mutations to functional performance are not fully settled. Consequently, the computational prediction of ncRNA structure and function has been limited.
1.6 Scientific Contribution
This dissertation makes three contributions to the exploration of how ncRNA sequences relate to their active structures. First, in Chapter Two, we built functional dictionaries for five model, self-cleaving ribozymes. These dictionaries contain all single and double mutational variants for the specified ribozyme. Each ribozyme’s sequence variants were obtained by an algorithmic search, written in the Julia language, that quickly aggregates each variant according to its cleavage state. The Julia code identified approximately four times the number of variants in one-fifteenth the time as previously used Python code. The cleavage activity for each variant was used to formulate a wide array of functional measurements that were employed to visualize structural features within each ribozyme. Combined these activities contribute valuable code and data to the exploration of mutational effects on active ncRNA structures.
Second, in Chapter Three, we built code to handle the more complex, time depen dent self-cleavage data that is often used in biochemistry experiments. The code fits a non-linear catalytic rate curve to observed cleavage data for the Twister self-cleaving ribozyme at multiple time points. The rates extracted using this code overcomes the limited dynamic range associated with observed cleavage rates (i.e., ranging from 0.0 to 1.0) by fitting an exponential decay function to each variant’s fraction cleaved.
This calculated catalytic rate possesses a significantly larger dynamic range (i.e., Twister’s range 10−6 to 10−3) and reveals reaction time periods that maximize the difference in rates between specific sequences. Consequently, variants with function ally different rates may be more easily distinguished. We further built a training tool that implements this analysis for use in future deep mutational scanning experiments. This web-based, Jupyter book is available for those looking to understand how parameter selection affects catalytic activity. While kinetics experiments are commonly performed in ribozyme biochemistry, there was no prior method to ex tract this data from high-throughput sequencing based approaches. The novel code developed enables a highly parallel analysis of this classic biochemical approach.
Finally, in Chapter Four, we develop a machine learning approach to predicting the fraction cleaved of higher-ordered CPEB3 mutants using only nucleotide sequences obtained from high-throughput, deep mutational scanning experiments. While machine learning models are commonly employed to make structural predictions, its utility for functional predictions has only recently been considered. Such models have been used to predict the functional activity associated with select positional mutations (Schmidt & Smolke, 2021), to predict the ligand class of 32 riboswitch families (Premkumaret al., 2020), and to guide evolutionary algorithms that optimize engineered proteins (Yang et al., 2019). These approaches all employ narrowly tailored data sets to the
achieve of a specific catalytic objective. We, however, employ a novel approach that uses a complete set of labeled, single and double mutation sequences combined with small sets of higher-order mutants to predict the fraction cleaved of any CPEB3 mutant. My approach is designed to take advantage of high-throughput data sets that are experimentally practicable in order to search the impracticable size of sequence space. Additionally, we report the first description of how a small set of higher-order mutations can be used to improve the predictive capability of a tractable and complete set of lower-order mutants. This suggests that a mapping of active sequences for bio-engineering purposes is achievable.
1.7 Future Directions
Together, the data, methods, and algorithms included above advance the study of how active ncRNA structures arise from sequence mutations and offers a path by which researchers could contribute their data to improve predictive algorithms. There are other, obvious directions for additional research into the structural and functional impact of ncRNA sequence mutations. For example, there are a variety of calculated relationships that could be incorporated as additional predictive ncRNA features.
Here we’ve calculated measurements of epistasis, relative fitness, fitness rescue, and Gibb’s free energy for each of our studied ribozymes. We also know from existing crystal structures the secondary structures contained within each ribozyme. These measures and structures could be incorporated as additions to the input vectors of future models and used to evaluate their predictive capacities. Another interesting questions is how ncRNA sequences are arranged in a map of sequences of any length. In our analysis, we only looked at how select sequence mutations within a ribozyme of a given length altered functional activity. But ribozyme sequences can also be lengthened or shortened by nucleotide insertions and deletions. Consequently, one could think of sequence space as the set of all sequences possessing some range of lengths. A lower dimensional mapping of known active ribozyme sequences within that range could reveal useful structural information in terms of position (where certain functional types aggregate) or composition (how combinations of secondary structure is arranged).
Finally, while we have here implemented machine learning algorithms to predict functional activity of easily measured self-cleaving ribozymes, there should be no reason why such a technique could not be applied to ncRNA possessing other, more difficult to measure activities. These ncRNA should be included in future machine learning algorithms to determine how to generalize such methods to other functional categories.
CHAPTER 2:
RNA SEQUENCE TO STRUCTURE ANALYSIS
FROM COMPREHENSIVE PAIRWISE
MUTAGENESIS OF MULTIPLE
SELF-CLEAVING RIBOZYMES
Jessica M. Roberts, James D. Beck, Tanner B. Pollock, Devin P. Bendixsen, and
Eric J. Hayden
doi: https://doi.org/10.1101/2022.05.17.4923491
Abstract
Self-cleaving ribozymes are RNA molecules that catalyze the cleavage of their own phosphodiester backbones. These ribozymes are found in all domains of life and are also a tool for biotechnical and synthetic biology applications. Self-cleaving ribozymes are also an important model of sequence to function relationships for RNA because their small size simplifies synthesis of genetic variants and self-cleaving activity is an accessible readout of the functional consequence of the mutation. Here we used a high-throughput experimental approach to determine the relative activity for every 1Accepted for publication in eLife- Roberts et al. (2022) possible single and double mutant of five self-cleaving ribozymes. From this data, we comprehensively identified non-additive effects between pairs of mutations (epistasis) for all five ribozymes. We analyzed how changes in activity and trends in epistasis map to the ribozyme structures. The variety of structures studied provided opportunities to observe several examples of common structural elements, and the data was collected under identical experimental conditions to enable direct comparison. Heat map based visualization of the data revealed patterns indicating structural features of the ribozymes including paired regions, unpaired loops, non-canonical structures and tertiary structural contacts. The data also revealed signatures of functionally critical nucleotides involved in catalysis. The results demonstrate that the data sets provide structural information similar to chemical or enzymatic probing experiments, but with additional quantitative functional information. The large-scale data sets can be used for models predicting structure and function and for efforts to engineer self-cleaving ribozymes.
2.1 Introduction
Challenges with predicting the functional effects of changing an RNA sequence continues to limit the study and design of RNA molecules. Recently, machine learning approaches have made considerable advancements in predicting an RNA structure from a sequence. However, these approaches rely heavily on crystal structures of RNA molecules and sequence conservation of homologs, both of which are limited for RNA molecules compared to proteins (Calonaci et al., 2020; Townshend et al., 2021). In addition, describing an RNA molecule as a single structure can be inaccu rate, and regulatory elements such as riboswitches demonstrate the importance of an ensemble of structures for an RNA function. It is unclear that predictions based on individual structures alone will be able to predict functional effects of mutations with the precision needed for many biotechnical and synthetic biology applications, or to predict disease-associated mutations in RNA molecules (Halvorsen et al., 2010). This
suggests that new experimental data types might be important for understanding, designing, and manipulating the transcriptome.
Self-cleaving ribozymes provide a useful model to study sequence-structure-function relationships in RNA molecules. Self-cleaving ribozymes are catalytic RNA molecules that cleave their own phosphodiester backbone. They were first discovered in viruses and viroids, but numerous families of self-cleaving ribozymes have since been discovered in all domains of life (Prody et al., 1986). The CPEB3 ribozyme, for example, was discovered in the human genome and found to be highly conserved in mammals (Bendixsen et al., 2021; Salehi-Ashtiani et al., 2006). Other self-cleaving ribozymes, such as the hammerhead and twister ribozymes, are found broadly distributed across eukaryotic and prokaryotic genomes (Perreault et al., 2011; Roth et al., 2014). The biological roles of ribozymes in different genomes and different genetic contexts remain an active area of investigation (Jimenez et al., 2015). In addition to being widespread across the tree of life, self-cleaving ribozymes have also been used for several bio engineering applications (Liang et al., 2011; Peng et al., 2021; Wei & Smolke, 2015; Zhong et al., 2016). For example, self-cleaving ribozymes are being combined with aptamers to develop synthetic gene regulatory devices, which have biotechnical and biomedical applications where ligand dependent control of gene expression is desired (Kobori et al., 2017, 2015; Stifel et al., 2019; Townshend et al., 2015).
The testing of mutational effects in ribozyme sequences has been accelerated by high-throughput experimental approaches. Most self-cleaving ribozymes are fairly small (¡200 nt) and genetic variants can be made by chemical synthesis of a single PCR oligonucleotide that is then used as a template for in vitro transcription. The self-cleavage activity of the ribozyme requires a precise three-dimensional structure, and therefore activity can be used as a sensitive indirect readout of native structure.
Mutations that disrupt the native structure are detected as reduced activity compared to the unmutated “wild-type” ribozyme. Several methods have been developed to enable the detection of ribozyme function by high-throughput sequencing of biochemical reactions (Bendixsen et al., 2019; Hayden, 2016; Kobori & Yokobayashi, 2016; Shen et al., 2021). For self-cleaving ribozymes, each read from the data re ports both the mutations and whether or not that molecule was reacted (cleaved) or unreacted (uncleaved). Therefore, high-throughput sequencing allows numerous genetic variants to be pooled together and still observed hundreds to thousands of times in the data. This provides confidence in the fraction cleaved for each genetic variant in a given experiment, and genetic variants are compared to determine relative activity. Importantly, the data is internally controlled because both reacted and unreacted molecules are observed, which controls for differences in their abundance due to synthesis steps (chemical PCR synthesis, transcription, reverse-transcription, PCR).
A common approach to confirm structural interactions in RNA and proteins is through analysis of pairs of mutations (Dutheil et al., 2010; Olson et al., 2014). In this context, it can be useful to calculate pairwise epistasis, which measures deviations in the mutational effects of double mutants relative to the effects of each individual mutation (assuming an additive model of mutational effects). For example, in the case of a base-pair, each single mutation would disrupt the base-pairing interaction, desta bilizing the catalytically active RNA structure and reducing activity. However, if two mutants together restore a base-pair, the relative activity of the double mutant would have much higher activity than expected from the additive effects of the individual mutations (positive epistasis). In contrast to paired nucleotides, double mutants at non-paired nucleotides tend to have a more reduced activity than expected from each individual mutation (negative epistasis) (Bendixsen et al., 2017; Li et al., 2016).
In the case of two mutations that create a different base pair (i.e. G-C to A-U), it is known that the stacking with neighboring base pairs is also structurally important, and some base pair substitutions will not be equivalent in a given structural context.
This creates a range of possible epistatic effects even for two mutations at paired nu cleotide positions. In addition, some non-canonical base interactions within tertiary contacts may also show epistasis even when they do not involve Watson-Crick or GU wobble base pairing interactions. Nevertheless, the propensity for positive epistasis between physically interacting nucleotides suggests that a comprehensive evaluation of pairwise mutational effects should contain considerable structural information.
Here, we report comprehensive analysis of mutational effects for all single and double mutants for five different self-cleaving ribozymes. Relative activity effects of all single and double mutations were determined by high-throughput sequencing of co-transcriptional self-cleavage reactions, and this data was used to calculate epistasis between pairs of mutations. The ribozymes studied include a mammalian CPEB3 ribozyme, a Hepatitis Delta Virus (HDV) ribozyme, a twister ribozyme from Oryza sativa, a hairpin ribozyme derived from the satellite RNA from tobacco ringspot virus, and a hammerhead ribozyme (Bendixsen et al., 2021; Burke & Greathouse, 2005; Chadalavada et al., 2007; Liu et al., 2014; M¨ uller et al., 2012). For each reference mutagenesis strategy was expected to produce all possible single and double mutants, as well as a random sampling of combinations of three or more mutations.
The mutagenized templates were transcribed in vitro, all under identical conditions, where active ribozymes had the opportunity to self-cleave co-transcriptionally. All ribozyme constructs studied cleave near the 5’-end of the RNA, and a template switching re verse transcription protocol was used to append a common primer binding site to both cleaved and uncleaved molecules. Subsequently, low cycle PCR was used to add indexed Illumina adapters for high-throughput sequencing. Each mutagenized ribozyme template was transcribed separately and in triplicate, and amplified with unique indexes so that all replicates could be pooled and sequenced together on an Illumina sequencer. The sequencing data was then used to count the number of times each unique sequence was observed as cleaved or uncleaved, and this data was used to calculate the fraction cleaved. The fraction cleaved of single and double mutants was normalized to the unmutated reference sequence to determine relative activity.
The relative activity values of the single and double mutants were used to calculate all possible pairwise epistatic interactions in all five ribozymes. We mapped epistasis values to each ribozyme structure to evaluate correlations between structural elements and patterns of pairwise epistasis values. The results indicated that structural features of the ribozymes are revealed in the data, suggesting that these data sets will be useful for developing models for predicting sequence-structure-function relationships in RNA molecules.
2.2 Results and Discussion
2.2.1 Evaluation of read depth and mutational coverage
The accuracy of our relative activity measurements depends on the number of reads we observe that map to each unique ribozyme sequence (read depth). Each reference ribozyme has a different nucleotide length resulting in different numbers of possible single and double mutants. In addition, the pooling of experimental replicates for sequencing does not result in equal mixtures of each replicate. In order to determine read depth, we mapped reads to the reference sequences and counted the number of reads that matched each ribozyme, while allowing for 1 or 2 mutations. We observed every single and double mutant for all ribozymes in each replicate, indicating 100% coverage of these mutant classes for all of our data sets. The distributions of observations for each single and double mutant of each ribozyme are shown in Supplementary Figure 1. The HDV data showed the lowest depth, possibly because it is a larger ribozyme (87 nt), and fewer reads mapped to the single and double mutants (Table 2.1). Nevertheless, from this analysis we conclude that the data contains complete coverage of all single and double mutants and ample read depth for all five ribozymes.

this study, and the number of single and double mutants whose cleavage
activity was analyzed.
2.2.2 Epistatic effects in paired nucleotide positions show stability-dependent signatures.
In order to evaluate how the effects of mutations mapped to the ribozyme structures, we plotted the relative activity values as heat maps (Figures 2.1-2.3). We then used this data to calculate epistasis between pairs of mutations. We first inspected nucleotide positions known to be involved in base-paired regions of the secondary structure of each ribozyme. In this heatmap layout, many paired regions showed an anti-diagonal line of high activity double mutant variants with strong positive epis tasis (Figures 2.1-2.3, insets). In addition, pairs of mutations off the anti-diagonal tended to show negative or non-positive epistasis. Pseudoknot elements that involve Watson-Crick base pairs also showed this pattern, including the single base pair T1 element in CPEB3 (Figure 2.1) and the two base pair T1 element in HDV (Figure 2.2). The layout of mutations in the heatmap places paired nucleotide positions along the anti-diagonal and compensatory double mutants that change one Watson-Crick base pair to another are found on this anti-diagonal. Individual mutations that break a base pair will often reduce ribozyme activity, but the activity can be restored by a second compensatory mutation resulting in positive epistasis. In contrast, double mutants off-diagonal usually disrupt two base pairs (unless they result in a GU wobble base pair). It is expected that breaking two base pairs in the same paired region would be more deleterious to ribozyme activity than breaking one base pair, but it appears that two non-compensatory mutations in the same paired region are more deleterious than expected from an additive assumption, and frequently create negative epistasis off-diagonal within paired regions.

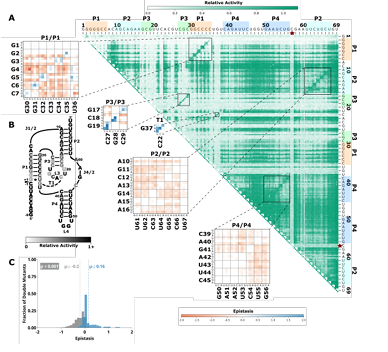
specific epistatic effects measured for each pair of mutations. Instances of positive epistasis are shaded blue, and negative epistasis is shaded red, with higher color intensity indicating a greater magnitude of epistasis. Catalytic residues are indicated by stars along the axes. B) Secondary structure of the CPEB3 ribozyme used in this study. Each nucleotide is shaded to indicate the average relative cleavage activity of all single muta
tions at that position. C) Histogram showing the distributions of epistasis in the paired regions of CPEB3. The distribution for double mutants within a paired region that are not involved in a base-pair is shown in grey, and the distribution for nucleotides involved in a base-pair is shown in blue.
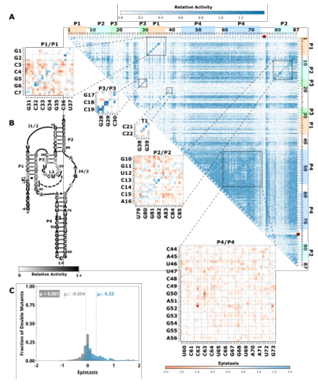

Figure 2.2: Comprehensive pairwise epistasis landscape for a HDV self cleaving ribozyme. A) Relative activity heatmap depicting all possible pairwise effects of mutations on the cleavage activity of an HDV ribozyme. Base-paired regions P1, P2, P3, P4, and T1 are highlighted and color coordinated along the axes, and surrounded by black squares within the heatmap. Pairwise epistasis interactions observed for each paired regions are each shown as expanded insets for easy identification of the specific epistatic effects measured for each pair of mutations. Instances of positive epistasis are shaded blue, and negative epistasis is shaded red, with higher color intensity indicating a greater magnitude of epistasis. Catalytic residues are indicated by stars along the axes. B) Secondary structure of the HDV ribozyme used in this study. Each nucleotide is shaded to indicate the average relative cleavage activity of all single mutations at that position. C) Histogram showing the distributions of epistasis in the paired regions of HDV. The distribution for double mutants within a paired region that are not involved in a base-pair is shown in grey, and the distribution for nucleotides involved in a base-pair is shown in blue.
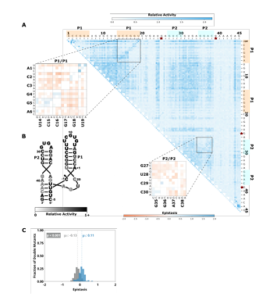

Figure 2.3: Comprehensive pairwise epistasis landscape for a hammerhead self-cleaving ribozyme. A) Relative activity heatmap depicting all possible pairwise effects of mutations on the cleavage activity of a hammerhead ribozyme. Base-paired regions P1, and P2 are highlighted and color coordinated along the axes, and surrounded by black squares within the heatmap. Pairwise epistasis interactions observed for each paired region are each shown as expanded insets for easy identification of the specific epistatic effects measured for each pair of mutations. Instances of positive epistasis are shaded blue, and negative epistasis is shaded red, with higher color intensity indicating a greater magnitude of epistasis. Catalytic residues are indicated by stars along the axes. B) Secondary structure of the hammerhead ribozyme used in this study. Each nucleotide is shaded to indicate the average relative cleavage activity of all single mutations at that position. C) Histogram showing the distributions of epistasis in the paired regions of hammerhead. The distribution for double mutants within a paired region that are not involved in a base-pair is shown in grey, and the distribution for nucleotides involved in a base-pair is shown in blue.
To quantify the observed difference in epistasis between nucleotide positions that form a base pair and two that do not, we plotted the distribution of epistasis values for double mutants on and off the anti-diagonal within the paired regions of each ribozyme. Statistical analysis indicated that the distributions were significantly different (p¡0.001, Mann-Whitney U-test), and the epistasis values between paired nucleotide positions (on-diagonal) were consistently more positive than two mutations in positions that are not directly base paired (off-diagonal). This analysis was con sistent for every individual paired region in each ribozyme (Figures 2.1-2.3, panel C).
This pattern of epistasis in paired regions demonstrates the utility of comprehensive double-mutant activity data for identifying base paired regions in RNA structures. It is interesting to note that the magnitude of the difference in the distributions of epistasis values for double mutants at paired and non-paired positions was different for different paired regions (Supplementary Figure 2.7). Specifically, short paired elements with fewer base pairs seemed to show large differences in the distributions of epistatic effects for paired and unpaired positions, while longer paired elements showed small differences in these distributions. For example, the short P3 (3 bp) in CPEB3 and HDV ,and T 1(4bp) inthetwister ribozyme showed very large differences between the distributions of epistasis values at paired versus non-paired positions.
These small regions are highly sensitive to mutations, and most pairs of mutations within this region result in almost no detectable activity except when they create a different Watson-Crick base pair (Figures 2.1-2.3). These structural elements have positive epistasis along the anti-diagonal, and negative epistasis off diagonal, resulting in large differences between the distributions of epistasis (Supplementary Figure 2.7). In contrast, the P4 stem in HDV has the most base pairs of any paired region in this data set (14), and losing one of these base pairs was not deleterious to riboyzme activity in our experiments (Figure 2.2).
Because the single mutations had little effects on the self-cleavage activity, a compensatory mutation restoring a base pair did not result in positive epistasis (Figure 2.2). Further, only weak negative epistasis is observed off-diagonal indicating that the loss of two base pairs in P4 was somewhat tolerated compared to shorter paired regions. The distributions for epistasis for paired and unpaired positions in P4 of HDV show only a small difference (Supplementary Figure 2.7). Together, the differences between epistasis in short and long base paired regions suggests that the thermodynamic stability of each paired region is important for the observed activity differences contributing to epistasis, which might ultimately affect the utility of this data for identifying paired regions in RNA structures.
In order to quantify the influence of thermodynamic stability on epistasis in different paired regions, we calculated the minimum free energy for each paired region and compared mutational effects. We split each paired region into two separate RNA sequences that contained only the base paired nucleotides and used nearest neighbor rules to calculate the minimum free energy of their interaction (NUPACK). This approach neglects thermodynamic contributions from terminal loops, but allowed for a consistent approach to compare internal and terminal paired regions. We found a significant negative correlation between the median deleterious effects of single mutations and the minimum free energy of the paired regions (Supplementary Figure 2.8).
This analysis indicates that more stable structural elements may be harder to identify from epistatic effects. However, it is possible that more stable elements would show stronger epistasis under different experimental conditions, such as different tempera tures or magnesium concentrations (Peri et al., 2022).
2.2.3 Catalytic residues do not have any high-activity mutants, and do not exhibit epistasis.
Self-cleaving ribozymes often utilize a concerted acid base catalysis mechanism where specific nucleobases act as proton donors (acid) or acceptors (base) (Jimenez et al.,2015), and mutations at these positions abolish activity. Analyzing the effects of individual mutations will not distinguish catalytic nucleotides from structurally important nucleotides. Comprehensive pairwise mutations, on the other hand, can potentially distinguish between structurally important nucleotides involved in paired regions that show positive epistasis from compensatory effects. The catalytic cytosines of the CPEB3 (C57) and HDV (C75) act as proton donors due to perturbed pKa values (Nakano et al., 2000; Skilandat et al., 2016). For the twister ribozyme (Figure 2.4) the guanosine at position G39 acts as a general base, and the adenosine at position A1 acts as a general acid (Wilson et al., 2016). The catalytic nucleotides for the Hammerhead ribozyme (Figure 2.3) are the Guanosines located at positions G25 and G39 (Scott et al., 2013). The hairpin ribozyme (Figure 2.5aps, the columns and rows associated with these nucleotides result in low activity values (Figures 2.1-2.3, Supplementary Figure 2.9).
It is important to note that because there is complete coverage of all double mutants in this data set, we can be certain that there are no possible compensatory mutations. These results show how catalytic residues can be identified in the comprehensive pairwise mutagenesis data.
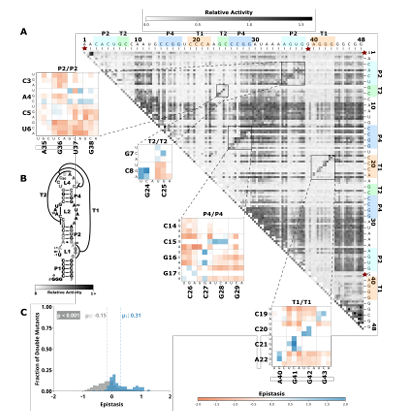

Figure 2.4: Comprehensive pairwise epistasis landscape for a twister self cleaving ribozyme. A) Relative activity heatmap depicting all possible pairwise effects of mutations on the cleavage activity of a twister ribozyme. Base-paired regions P2, P4, T1, and T2 are highlighted and color coordinated along the axes, and surrounded by black squares within the heatmap. Pairwise epistasis interactions observed for each paired region are each shown as expanded insets for easy identification of the specific epistatic effects measured for each pair of mutations. Instances of positive epistasisare shaded blue, and negative epistasis is shaded red, with higher color in tensity indicating a greater magnitude of epistasis. Catalytic residues are indicated by stars along the axes. B) Secondary structure of the twister ribozyme used in this study. Each nucleotide is shaded to indicate the average relative cleavage activity of all single mutations at that position. C) Histogram showing the distributions of epistasis in the paired regions of twister. The distribution for double mutants within a paired region that are not involved in a base-pair is shown in grey, and the distribution for nucleotides involved in a base-pair is shown in blue.
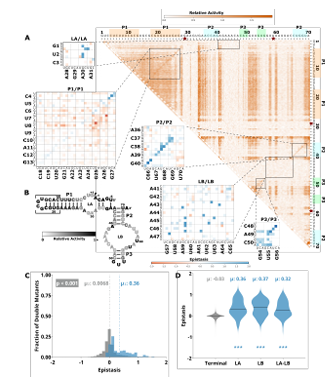

Figure 2.5: Comprehensive pairwise epistasis landscape for a hairpin self cleaving ribozyme. A) Relative activity heatmap depicting all possible pairwise effects of mutations on the cleavage activity of a hairpin ribozyme. Base-paired regions P1, P2, and P3 are highlighted and color coordinated along the axes, and surrounded by black squares within the heatmap. Pairwise epistasis interactions observed for each paired region are each shown as expanded insets for easy identification of the specific epistatic effects measured for each pair of mutations. Instances of positive epistasis are shaded blue, and negative epistasis is shaded red, with higher colorintensity indicating a greater magnitude of epistasis. Catalytic residues are indicated by stars along the axes. B) Secondary structure of the hairpin ribozyme used in this study. Each nucleotide is shaded to indicate the average relative cleavage activity of all single mutations at that position. C) Histogram showing the distributions of epistasis in the paired regions of hairpin.
The distribution for double mutants within a paired region that are not involved in a base-pair is shown in grey, and the distribution for nucleotides involved in a base-pair is shown in blue. D) Violin plots showing the distributions of epistasis in all terminal stem loops across all five ribozymes, and epistasis observed within loop A, loop B, and between loop A and loop B in the hairpin ribozyme.
2.2.4 Unpaired nucleotides show tertiary structure dependent mutational effects.
Mutations to nucleotides found in terminal loops that are not involved in tertiary structure elements showed high relative activity for most single and double mutants, and essentially no epistasis. This is not surprising if these loops reside on the periphery of the ribozyme and are not involved in structural contacts with other nucleotides. This is the case for L4 of the CPEB3 and HDV ribozymes (Figure 2.1, Figure 2.2), and L1 and L3 of the hairpin ribozyme (Figure 2.5). Two mutations within these loops do not reduce activity, and mutations in these loops do not rescue other deleterious mutations such as those that break a base pair (Figures 2.1, 2.2, and 2.5).
The internal loops (LA and LB) of the hairpin ribozyme are structurally important (Figure 2.5). Interactions between nucleotides within LB include six non-Watson Crick base pairing interactions that are important for the formation of an active ribozyme structure (Fedor, 2000). Several non-canonical base-base and sugar-base hydrogen bonds between nucleotides within LA are also important for the formation of the active site (Fedor, 2000; Wilson et al., 2006). Docking between LA and LB is necessary for the formation of a catalytically active ribozyme and is facilitated by a Watson-Crick base pair between G1 and C46 in the version of the ribozyme used here (Rupert & Ferr´e-D’Amar´ e, 2001). In contrast to terminal loop regions, most single mutations within LA and LB resulted in low self-cleavage activity in our data (Figure 2.5). In addition, the double mutants within and between loop A and loop B show several instances of strong positive epistasis (Figure 2.5, Insets), and the dis tributions of epistasis within and between these loops are significantly different than the terminal loops that are not structurally important (Figure 2.5D). This positive epistasis indicates that many of the important structural contacts can be facilitated by other specific pairs of nucleotides.
For example, the double mutant G1C and C46G shows strong epistasis suggesting that swapping a C-G base pair for the G-C base pair can restore activity by facilitating docking between the two loops. Several double mutants at positions that form non-canonical interactions in LB show positive epistasis. For example, mutation A41G shows positive epistasis when the interacting nucleotide C65 is mutated to a G or U. The non-canonical base pair G42:A64 shows positive epistasis for the mutations G42U A64G. The non-canonical A45:A59 interaction shows positive epistasis for several pairs of mutations (A45U A59C, A45C A59C, A45G A59U). Finally, the non-canonical base pair A47:G57 in LB, and C3:A28 in LA, both show positive epistasis for double mutants that result in an AU base pair.
This analysis indicates that important structural contacts can be achieved with several different nucleotide combinations. The difference between terminal loops and loops with structural importance highlights how activity-based data can help identify non-canonical structures that are challenging to predict computationally, and that might be difficult to identify by other common approaches, such as chemical probing experiments (Walter et al., 2000).
Another example of structurally important unpaired regions can be found in the CUGA uridine turn (U-turn) motif in the hammerhead ribozyme (Figure 2.3). This CUGA turn forms the catalytic pocket and positions a catalytic cytosine (-1C) at the cleavage site (Doudna, 1995). A crystal structure of the sTRSV ribozyme showed a base pair between the nucleotides corresponding to C20 and G25 in the ribozyme construct used for our experiments (Chi et al., 2008). These two nucleotides showed strong positive epistasis for the mutations C20G and G25C, which substitutes a G:C base pair for the original C:G base pair.
All other single and double mutants in this region showed low activity, and no instances of strong positive epistasis within or between this motif (Figure 2.3). The low activity resulting from mutations in this region confirms the functional importance of this motif, and indicates that this motif cannot be easily formed or rescued by sequences with up to two mutational differences, except for the G:C base pair swap.
Tertiary interactions between loops in the hammerhead ribozyme provide another example of structurally important loop regions. Type III hammerhead ribozymes, like the one used in this study, contain tertiary interactions between nucleotides in the loops of P1 and P2 that are implicated in structural organization of the catalytic core. A crystal structure of this loop-loop interaction showed a network of interhelical non-canonical base pairs and stacks, with several nucleobases in stem-loop I interacting with more than one nucleobase in stem-loop II (Chi et al., 2008; Martick & Scott, 2006).
However, there are numerous different loop sequences in naturally occurring hammerhead ribozymes indicating that this loop-loop interaction can be formed by a variety of different sequences (Burke & Greathouse, 2005; Perreault et al., 2011). We therefore anticipated that the we would observe a significant level of positive epistasis between these two loops for double mutations that were capable of maintaining these tertiary interactions. Surprisingly, however, we found that most individual and double mutations do not reduce activity (Figure 2.3), and double mutants do not show positive epistasis (Supplementary Figure 2.10). This indicates that the multiple interactions between the loops compensate for mutations that break a single interaction. It is interesting to note that the mutational robustness of these loops has been exploited in bioengineering applications, where insertion of an aptamer into one of the loops and randomization of the other allowed for the selection of synthetic ri
boswitches (Townshend et al., 2015). The identification of robust structural elements though high-throughput mutational data could be useful for identifying better targets for aptamer integration in other ribozymes.
2.2.5 Epistasis plots are an informative approach to visualizing high-throughput activity data
Previous studies have reported comprehensive pairwise mutagenesis of ribozymes that provide interesting opportunities for comparison to the data presented here. For example, all pairwise mutations in a 42-nucleotide region of the same twister ribozyme were previously reported (Kobori & Yokobayashi, 2016). Compared to our experiments, these previous experiments used a later transcriptional time point (2h) and lower magnesium concentration (6mM). They did not calculate epistasis, and reported the Relative Activity of all double mutants using heatmaps similar to the figures presented here. The results were highly similar, and the authors were able to identify paired regions in the data. The similarity between the results illustrates the reliability of this sequencing-based approach, which is promising for future data sharing and meta-analysis efforts. In another prior work, all pairwise mutations in the glmS ribozyme were analyzed using a custom-built fluorescent RNA array (An dreasson et al., 2020). The power of this approach is that they were able to monitor self-cleavage over short and long time scales, which enables differentiating both very slow and very fast self-cleaving variants. While the authors did not calculate pairwise epistasis, they reported relative activity heatmaps and also “rescue effects” when the activity of a double mutant is sufficiently higher than the activity of a single mutant. This rescue analysis is very similar to positive epistasis, but only takes into account one mutation at a time. This analysis was also able to identify many of the know base-pair interactions and some tertiary contacts in the glmS ribozyme.
In addition, they were able to observe some minor secondary structure rearrangement, where mutations in some nucleotides were able to rescue neighboring nucleotides by shifting the base-pairing slightly. The pairwise epistasis analysis presented here adds an additional approach to extract information from such high-throughput sequencing-based analysis of self-cleaving ribozymes. Unlike the rescue analysis, which can only identify positive interactions, the ability to detect negative epistatic interactions may help fur ther identify structurally important regions for RNA sequence design and engineering efforts.
2.2.6 Conclusion
We have determined the relative activity for all single and double mutants of five self-cleaving ribozymes and use this data to calculate epistasis for all possible pairs of nucleotides. The data was collected under identical co-transcriptional conditions, facilitating direct comparison of the data sets. The data revealed signatures of structural elements including paired regions and non-canonical structures. In addition, the comprehensiveness of the double mutants enabled identification of catalytic residues. Recently, there has been significant progress towards predicting RNA structures from sequence using machine learning approaches. The machine learning models are typically trained on structural biology data from x-ray crystallography, chemical probing (SHAPE), and natural sequence conservation. Self-cleaving ribozymes have been central to this effort. Our approach is similar to SHAPE in that it can be obtained with common lab equipment and commercially available reagents. The activity data presented provides information similar to natural sequence conservation, except that it provides quantitative effects of mutations, not just frequency.
We hope that the activity-based data presented here will provide information not present in these other training data sets and help advance computational predictions.
2.3 Materials and Methods
Mutational library design and preparation of self-cleaving ribozymes Single-stranded DNAmolecules used as templates for in vitro transcription were synthesized with 97% of the base of the reference sequence and 1% of the three other remaining bases at each position (Keck Oligo Synthesis Resource, Yale). The single-stranded Deoxyribose Nucleic Acid (ssDNA) library was made double stranded to allow for T7 transcription via low cycle PCR using Taq DNA polymerase.
2.3.1 Co-transcriptional self-cleavage assay
The co-transcriptional self-cleavage reactions were carried out in triplicate by combining 20 µL 10X T7 transcription buffer (500 µL 1M Tris pH 7.5, 50 µL 1M DTT, 20 µL 1M Spermidine, 150 µL 1M MgCl2, 280 µL RNase Free water), 4 µL rNTP (25mM, NEB, Ipswich, Ma), 8 µL T7 RNA Polymerase-Plus enzyme mix (1,600 U, Invitrogen, Waltham, Ma), 160 µL nuclease free water, and 8 µL of double stranded DNA template (4 pmol, 0.5 µM PCR product) at 37°C for 30 minutes. The tran scription and co-transcription self-cleavage reactions were quenched by adding 60 uL of 50 mM EDTA. The resulting RNA was purified and concentrated using Direct-zol RNA MicroPrep Kit with TRI-Reagent (Zymo Research, Irvine, Ca), and eluted in 7µL nuclease free water. Concentrations were determined via absorbance at 260 nm (ThermoFisher NanoDrop, Waltham, Ma), and normalized to 5µM. Reverse tran scription reactions used 5 picomoles RNA and 20 picomoles of reverse transcription primer in a volume of 10 µL. RNA and primer were heated to 72 °C for 3 mins and cooled on ice. Reverse transcription was initiated by adding 4 µL SMARTScribe 5x
First-Strand Buffer (TaKaRa, San Jose, Ca ), 2 µL dNTP (10 mM), 2 µL DTT (20 mM), 2 µL phased template switching oligo mix (10 µM), and 2 µL SMARTScribe Reverse Transcriptase (200 units, TaKaRa) (Bendixsen et al., 2020). The mixture was incubated at 42 °C for 90 mins and the reaction was stopped by heating to 72 °C for 15 mins. The resulting cDNA was purified on a silica-based column (DCC-5, Zymo Research) and eluted into 7 µL water. Illumina adapter sequences and indexes were added using high-fidelity PCR. A unique index combination was assigned to each ribozyme and for each replicate. The PCR reaction contained 3 µL purified comple mentary Deoxyribose Nucleic Acid (cDNA), 12.5 µL KAPA HiFi HotStart ReadyMix (2X, KAPA Biosystems, Wilmington, Ma), 2.5 µL forward, 2.5 µL reverse primer (Illumina Nextera Index Kit) and 5 µL water. Several cycles of PCR were examined using gel electrophoresis and a PCR cycle was chosen that was still in logarithmic amplification, prior to saturation. Each PCR cycle consisted of 98 °C for 10 s, 63 °C for 30 s and 72 °C for 30 s. PCR PCR was purified on silica-based columns (DCC-5, Zymo Research) and eluted in 22.5 µL water. The final product was then verified using gel electrophoresis.
2.3.2 High-throughput sequencing
The indexed PCR products for all replicates were pooled together at equimolar concentrations based off of absorbance at 260 nm. Paired end sequencing reads were obtained for the pooled libraries using an Illumina HiSeq 4000 (Genomics and Cell Characterization Core Facility, University of Oregon).
2.3.3 Sequencing data analysis
Paired-end sequencing reads were joined using Fast Length Adjustment of Sort reads (FLASh), allowing ‘outies’ due to overlapping reads. The joined sequencing reads were analyzed using custom Julia scripts that implement a sequence- length sliding window to screen for double mutant variants of a reference ribozyme. Nucleotide identities for each mutant were identified and then counted as either cleaved or uncleaved based on the presence or absence of the 5’-cleavage product sequence. The relative activity (RA) was calculated as previously described (Kobori & Yokobayashi, 2016).
Briefly, a fraction cleaved (FC) was calculated for each genotype in each replicate as FC= Nclv/(Nclv + Nunclv). This value was normalized to the reference/wild type fraction cleaved as RA = FC/FCwt. The RA values were averaged across the three replicates and then plotted as a heatmap. Epistasis interactions for each double
mutant (i, j) were quantified as previously described (Bendixsen et al., 2017), where
Epistasis (ϵ) = log(i,j) log(i)log(j) .
In order to eliminate false positive detection of epistasis interactions, values were filtered to eliminate instances where the difference between the double and any of the single mutants was less than 1-3σ of the overall distribution of differences between the single and double mutant relative activities. Values greater than 1 indicate positive epistasis, and values less than zero indicate negative epistasis. Mann-Whitney U-test was used to determine the probability that epistasis or activity values of different structural elements were from the same distribution.In order to eliminate false positive epistasis values where the .
2.3.4 Correlation of thermodynamic stability of paired regions and observed mutational effects.
Each base paired region was split into two separate RNA sequences containing only the nucleotides involved in base pairing, omitting nucleotides belonging to stem loops. Complex formation between each pair of strands at was analyzed in Nupack using Serrra and Turner RNA energy parameters in order to obtain minimum free energy values for each paired region (37°C, [1µM]). Using custom Julia scripts, the median relative activity for single mutations to each paired region was plotted as a function of the calculated free energy and a Pearson correlation coefficient was calculated.
2.3.5 Acknowledgements
The authors acknowledge funding from the National Science Foundation (EH, grant number OIA-1738865, OIA-1826801), National Aeronautics and Space Administration (EH, grant number 80NSSC17K0738), and the Human Frontier Science Program (EH, Ref.-No: RGY0077/2019).
2.3.6 Competing Interests Statement
The authors declare that no competing interests exist.
2.3.7 Data Availability
Sequencing reads in FastQ format are available at ENA (PRJEB52899). Sequences, activity data, and computer code is available at GitLab (https://gitlab.com/bsu/ biocompute-public/mut_12).
2.3.8 Supplementary Materials

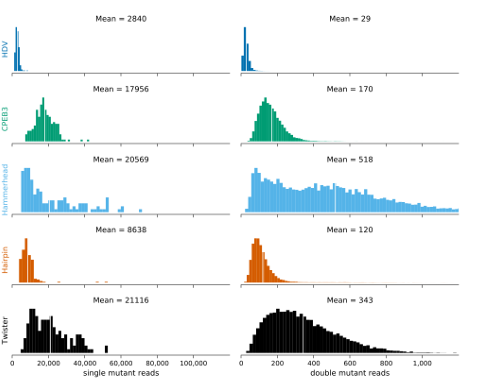
the single and double mutants matching to each ribozyme analyzed in this
study (HDV, CPEB3, hammerhead, hairpin, twister

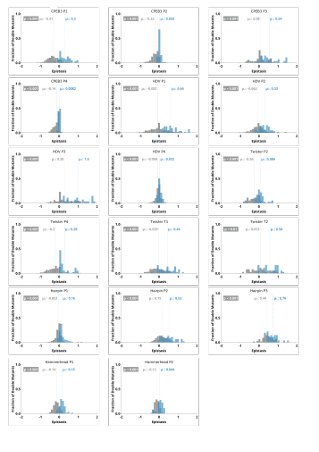

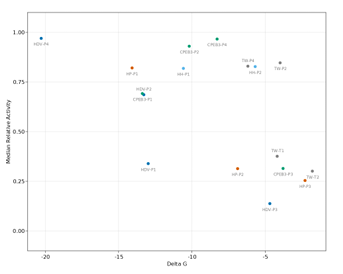

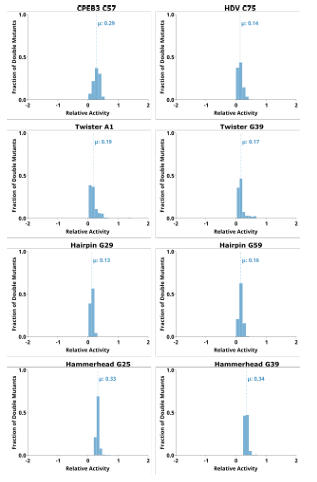

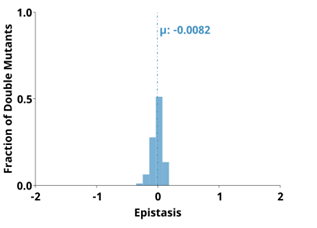

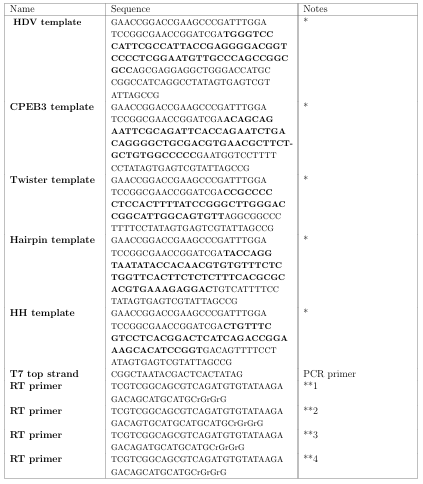
CHAPTER 3:
ANALYSIS OF CATALYTIC ACTIVITY FOR
THE SELECTION OF TIME PARAMETERS
FOR TWISTER SELF-CLEAVING RIBOZYMES
James D. Beck, Jessica M. Roberts, Jeremy Herrera, and Eric J. Hayden
A Jupyter Book1
Abstract
Ribozymes are ncRNA molecules that catalyze biochemical reactions. Because a ribozyme’s structure relates to its catalytic abilities, a further area of inquiry seeks to correlate structure and catalytic abilities to mutational variation. One well studied class of ribozyme that is particularly suited to such an inquiry is the self-cleaving
ribozyme, a molecule that catalyzes the cleavage of its phosphodiester backbone. The affects of mutations on self-cleaving activity can be easily measured by sequencing many copies of ribozyme variants over multiple experimental replicates and observing the number of times each variant was found in a cleaved or uncleaved form. The observed counts serve as the basis for identifying structurally important features 1Accessible at https://bsu.gitlab.io/bio-computing/ribo-k-book/intro.html and doi: https://doi.org/10.5281/zenodo.7139783
within the ribozyme and to computationally predict the catalytic activity of higher order mutants. However, the reactions used to create the sequenced variants produce only a noisy estimate of each ribzoyme’s catalytic ability.
The reactions generate a fraction cleaved for each ribozyme variant (EquationA.2). Each reaction synthesizes many individual variant copies that fold into structures affecting their ability to cleave. Consequently, the reaction duration affects the fraction cleaved for each self-cleaving ribozyme based on when in the reaction the ribozyme was synthesized and how quickly the ribozyme folds into an active state.
Some variants will quickly fold into an active state while others will either take longer to fold or will misfold into an inactive structure. Shorter duration reactions will cause slow folding variants to have lower fraction cleaved because those synthesized near the end of the reaction will not have had the time to complete their folding. Longer duration reactions will cause most variants to have a higher fraction cleaved because all synthesized sequences will have adequate time to fold. Selecting time parameters for the reaction, therefore, is an important factor affecting each variant’s fraction cleaved.
The fraction cleaved can be used to calculate an observed catalytic rate for each variant (kobs, Equation A.3). kobs is obtained by fitting an exponential decay function to the fraction cleaved for multiple experimental replicates at multiple time periods. The kobs value that produces the least square error amongst the fraction cleaved values is selected. kobs provides a measure of activity that is not reliant on a variant’s folding speed at any particular time. Instead, kobs reports a single value that represents the folding activity over all time periods. Additionally, kobs values can yield a much larger dynamic range than can be found using the fraction cleaved (which, by definition, can only range between 0 and 1).
The dynamic range is important to differentiating structure, particularly when mutations occur in tolerant positions. kobs is, therefore, preferable when cleavage data is available for multiple time periods. This chapter was designed to train students on the fundamentals of fitting ob served data for multiple time periods to known catalytic functions. The included code is written and documented in such a way as to provide a basic understanding of the analysis without reliance on curve fitting software packages. This chapter was also intended to provide a starting point for researchers to evaluate the many other experimental parameters that affect kobs. It is my hope that the repository and tools organized to create this chapter will be expanded for future lab use.
CHAPTER 4:
PREDICTING HIGHER-ORDER MUTATIONAL
EFFECTS IN AN RNA ENZYME BY MACHINE
LEARNING OF HIGH-THROUGHPUT
EXPERIMENTAL DATA
James D. Beck, Jessica M. Roberts, Joey Kitzhaber, Ashlyn Trapp, Edoardo Serra,
Francesca Spezzano, and Eric J. Hayden
doi: https://doi.org/10.1101/2022.05.31.4940171
Abstract
Ribozymes are RNA molecules that catalyze biochemical reactions. Self-cleaving ribozymes are a common naturally occurring class of ribozymes that catalyze site specific cleavage of their own phosphodiester backbone. In addition to their natural functions, self-cleaving ribozymes have been used to engineer control of gene expression because they can be designed to alter RNA processing and stability. However, the rational design of ribozyme activity remains challenging, and many ribozyme-based 1Accepted for publication in Frontiers in Molecular Biosciences Biological Modeling and Simulation- Beck et al. (2022) systems are engineered or improved by random mutagenesis and selection (in vitro evolution). Improving a ribozyme-based system often requires several mutations to achieve the desired function, but extensive pairwise and higher-order epistasis pre
vent a simple prediction of the effect of multiple mutations that is needed for rational design.
Recently, high-throughput sequencing-based approaches have produced data sets on the effects of numerous mutations in different ribozymes (RNA fitness land scapes). Here we used such high-throughput experimental data from variants of the CPEB3 self-cleaving ribozyme to train a predictive model through machine learning approaches. We trained models using either a random forest or long short-term memory (LSTM) recurrent neural network approach. We found that models trained on a comprehensive set of pairwise mutant data could predict active sequences at higher mutational distances, but the correlation between predicted and experimen tally observed self-cleavage activity decreased with increasing mutational distance.
Adding sequences with increasingly higher numbers of mutations to the training data improved the correlation at increasing mutational distances. Systematically reducing the size of the training data set suggests that a wide distribution of ribozyme activity may be the key to accurate predictions. Because the model predictions are based only on sequence and activity data, the results demonstrate that this machine learning approach allows readily obtainable experimental data to be used for RNA design efforts even for RNA molecules with unknown structures. The accurate prediction of RNA functions will enable a more comprehensive understanding of RNA fitness landscapes for studying evolution and for guiding RNA-based engineering efforts.
4.1 Introduction
RNAenzymes, or ribozymes, are structured RNA molecules that catalyze biochemical reactions. One well-studied class of ribozymes are the small self-cleaving ribozymes that catalyze site specific cleavage of phosphate bonds in their own RNA backbone (Ferre-D’Amare & Scott, 2010). These self-cleaving ribozymes are found in all do mains of life, and their biological roles are still being investigated (Jimenez et al., 2015). In addition to their natural functions, these ribozymes have been used as the basis for engineering biological systems. For example, several small ribozymes (hammerhead, twister, pistol and HDV) have been used as genetically encoded gene regulatory elements by combining them with RNA aptamer and embedding them into untranslated regions of genes (Groher & Suess, 2014; Dykstra et al., 2022).
This approach continues to gain attention because of the central importance of control ling gene expression and the simple design and build cycles of these small RNA elements. Nevertheless, ribozymes often need optimization for sequence dependent and cell specific effects. This can be achieved by modifying the sequence of the ri bozymes, but this often requires multiple mutational changes and the vast sequence space requires extensive trial and error. Given this large sequence space, even the most high-throughput approaches can only find the optimal solutions present in the sequences that can be explored experimentally, which is a fraction of the total possible sequences. The engineering of ribozyme-based systems could benefit from accurate
prediction of the effects of multiple mutations in order to narrow the search space
towards optimal collections of sequences.
One way to think of the ribozyme optimization problem is in terms of fitness landscapes. Molecular fitness landscapes of protein and RNA molecules are studied by measuring the effects of numerous mutations on the function of a given reference molecule (Athavale et al., 2014; Blanco et al., 2019). Recently, the fitness landscapes of RNA molecules have been studied experimentally by synthesizing large numbers of sequences and using high-throughput sequencing to evaluate the relative activity of the RNA in vitro, or the growth effect of the RNA in a cellular system, both of which are termed “RNA fitness” (Kobori & Yokobayashi, 2016; Li et al., 2016; Pressman et al., 2019). The goal of in vitro evolution is often to find the highest peak in the landscape, or one of many high peaks, by introducing random mutations and selecting for improved activity. However, the RNA fitness landscapes that have been experimentally studied so far have revealed rugged topographies with peaks of
high relative activity and adjacent valleys of low activity.
Landscape ruggedness is an impediment to finding desired sequences through in vitro evolution approaches (Ferretti et al., 2018). Epistasis, defined as the non-additive effects of mutations, is the cause of ruggedness in fitness landscapes, and epistasis has been used to quantify the ruggedness of fitness landscapes (Szendro et al., 2013). More frequent and more extreme epistasis indicates that a landscape is more rugged. Importantly, more epistasis also means that the effect of combining multiple mutations is challenging to predict even if the effects of each individual mutation are known. In addition, experimental fitness landscapes can only study a limited number of sequences, except for very small RNA molecules (Pressman et al., 2019). It is often not possible to know if the process of in vitro evolution discovered a sequence that is globally optimal, or just a local optimum. For these reasons, it has become a goal to accurately predict the activity of sequences in order to streamline RNA evolution experiments and to study fitness landscapes in a more comprehensive manner (Groher et al., 2019; Schmidt & Smolke, 2021).
Here, we use high-throughput experimental data of mutational variants of a self cleaving ribozyme to train a model for predicting the effect of higher-order combinations of three or more mutations. The ribozyme used in this study is the CPEB3 ribozyme (Figure 4.1A). This ribozyme is highly conserved in the genomes of mammals, where it is found in an intron of the CPEB3 gene (Salehi-Ashtiani et al., 2006). For training purposes, we generated a new data set that includes all possible individual and pairs of mutations to the reference CPEB3 ribozyme sequence (Figure 4.1B).
These mutations were made by randomization of the CPEB3 ribozyme sequence with a 3% per nucleotide mutation rate during chemical synthesis of the DNA template. Wereasoned that given the extensive amount of pairwise epistasis in RNA (Bendixsenet al., 2017), this data set might be sufficient for predicting higher-order mutants. In addition, we used a second, previously published data set that included 27,647 sequences comprised of random permutations of mutations found in mammals that include up to 13 mutational differences from the same reference ribozyme (Bendixsen et al., 2021). This second data set not only contains higher-order mutational combi nations, but also a broad range of self-cleaving activity (Figure 4.1D). In both data sets, the relative activity of each sequence was determined by the deep sequencing of co-transcriptional self-cleavage data, as previously described. Briefly, the mutated DNA template was transcribed in vitro with T7 RNA polymerase.
The transcripts were prepared for Illumina sequencing by reverse transcription and PCR. Relative activity was determined as the fraction cleaved, defined by the fraction of sequencing reads that mapped to a specific sequence variant in the shorter, cleaved form relative to the total number of reads for that sequence variant.

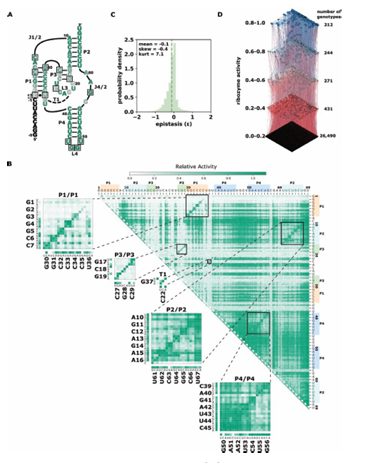
Weset the goal of being able to predict the activity of the higher-order mutants in the phylogenetically derived fitness landscape (Figure 4.1D). In addition, we wanted to guide future experiments aimed at producing additional data for training models of ribozyme-based systems. The number of possible sequences increases exponentially with the number of variable nucleotide positions. In addition, the probability of finding active ribozymes at higher mutational distances becomes increasingly unlikely. Experiments aimed at training predictive models will need to choose realistic numbers of sequences that can have the highest impact on model performance. We therefore evaluated the effect of adding to the training data sequences with increasing mutational distances from the wild-type sequence as well as the effect of reducing the number of sequences in the training data. The results of these experiments were expected to be useful in guiding the choice of which sequence variants, and how many, to analyze experimentally in order to produce effective training data sets.
4.2 Results
We first evaluated our new training data set that contained all single and double mutants of the CPEB3 ribozyme. We found that the data did in fact contain full coverage of the possible 207 single mutants and the 21,114 double mutants. While the number of reads that mapped to each of these sequences varied, we found that, on average, 170 reads mapped to each double mutant, and 18,000 reads mapped to each single mutant (Supplemental Figure 4.5). This read depth was sufficient for the determination of the fraction cleaved for all single and double mutants (Figure 4.1B). Mapping the fraction cleaved to base paired structural elements showed expected patterns of activity caused by compensatory base pairs. Mutations that break a base pair typically showed low activity, but a second mutation that restored the base pair showed high activity. To further evaluate this data, we calculated the non-additive pairwise epistasis in this data set (Figure 4.1C). Together, this analysis indicated that this data set contained a wide range of ribozyme activity and the effects of all pairwise intramolecular epistatic interactions.
In order to determine the training potential of the comprehensive double-mutant data, we first trained models using only the fraction cleaved data for sequences with two or fewer mutations including the wild-type reference sequence. We then tested the models’ performance in predicting the fraction cleaved for sequences with in creasing numbers of mutations. We trained two models with two approaches (see Materials and Methods). The first approach used a Random Forest regressor. In the second approach, we added a Long Short-Term Memory (LSTM) recurrent neural network to extract hidden features from the data. We then fed the hidden features with associated fraction cleaved to a Random Forest regressor. We will refer to this approach as “LSTM”. We found that models trained on 2 or fewer mutations with Random Forest outperformed LSTM at predicting the activity of sequences with five or fewer mutations (Figure 4.2 A-C), but LSTM performed better when predicting the activity of sequences with six or more mutations relative to the wild-type (Figure 4.2 D-I).
However, both approaches showed a decrease in the correlation between predicted and observed when challenged to predict the activity of sequences with higher numbers of mutations, and both resulted in relatively low correlation (Pearson r < 0.7) for sequences with seven or more mutations when trained only on this double mutant data (Figure 4.2 and Supplementary Table 4.3). We concluded that models trained on simple random mutagenesis containing all double mutants can be useful for predicting lower mutational distances, but we anticipated that additional data might improve the ability to predict the effect of higher numbers of mutations.

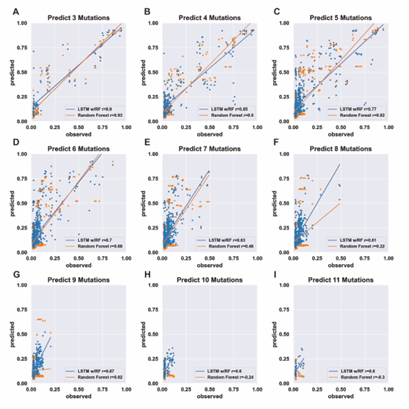
To determine the effect of adding higher-order mutants to the training data, we divided the phylogenetic derived sequence data by mutational distance and re-trained models with increasing orders of mutations in the training set. As expected, adding higher-order mutants improved the predicted to observed correlation at higher mu tational distances (Figure 4.3 and Supplemental Figures 4.6-4.15). Interestingly, we found that the Random Forest approach outperformed the LSTM approach when sequences with more mutations were included in the training data. This is especially apparent for predicting the activity of sequences with 8-10 mutations.
The Random Forrest approach resulted in models with high correlation between predicted and ob served for all mutational distances when trained with data from sequences with four or more mutations (Figure 4.3 A-C). For both approaches, the largest improvements in the correlations occurred when sequences with 3 mutations (relative to wild-type) were added to the data. Subsequently appending additional sequences with greater numbers of mutations had diminishing improvements on the correlation. We note that all the testing data was set aside prior to training and identical testing data was used for all models.
The results demonstrate that adding higher order mutants to the training data improves the Pearson correlation of sequences at higher distances in this data set. It is important to note that the phylogenetically derived data has different numbers of sequences for each class of mutations (Table 4.1), and sequences with higher numbers of mutations in our data show mostly low activity (Supplementary Figure 4.17). This helps interpret the effect of sequentially adding higher-order mutant sequences to the training data. It is also important to note that the phylogenetic derived sequences only contain mutations at thirteen different positions. The higher order sequences in this data are therefore combinations of the lower order sequences. For example, a sequence with six mutations can be constructed by combining two sequences with three mutations, both of which would be in the “3 mutations” training data. Our model is therefore predicting the effects of combining sets of mutations, and adding precise sets of lower order mutations that re-occur in higher order mutations clearly improves the correlations between prediction and experimental observation in our data.

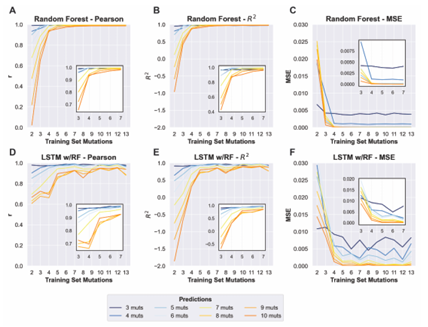

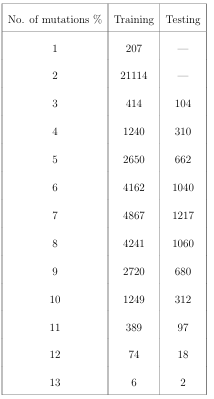
In order to inform future experiments for collecting training data, we next set out to determine the effect of decreasing the amount of data in the training sets. Starting from the 80% of data used as prior training data, we randomly sampled sequences from this data to create new training data sets with 60%, 40%, 20%, 10% and 1% of the total data. These subsampled data sets were used to train models using the random forest regressor. The same testing data was set aside for all models and used to compare the Pearson correlation coefficient of each model trained with decreasing amounts of data.
As an illustrative example, we focused on a model trained with sequences with 5 or fewer mutations relative to wild-type used to predict the activity of sequences with 7 mutations (Figure 4.4 and Supplementary Table 4.5). We
chose this example because it achieved very high correlation (Pearson r = 0.99) when trained with 80% (25,733 unique sequences) of the data and therefore provided an opportunity to observe how rapidly the correlation decreased with less data. We found that the models trained on 5 or fewer mutations predicted with high correlation when as little as 40% (12,866) of the data was used for training (Pearson r = 0.97). With only 20% (6,433) and 10% (3,217) of the data, the model still showed good prediction accuracy with a Pearson correlation r ≈ 0.9. Surprisingly, we still observed reasonably high correlation when including only 1% (322) of the training data, and this was reproducible over five different models trained with different random samples of the data (Pearson r = 0.81, stdev = 0.046, n = 5). Similar results were observed with other training and testing scenarios. To illustrate general trends, we have plotted the Pearson correlation for the same model trained on 5 or fewer mutations when predicting the activity of sequences with 6, 7, 8 or 9 mutations, and for a model trained on 9 or fewer mutations used to predict sequences with 5, 6, 7, or 8 mutations (Figure 4.4).
This analysis suggests that the total amount of training data is not critical for predicting the activity of sequences in our data set. When combined with the diminishing returns of adding more higher order mutations (Figure 4.3), this analysis emphasizes the importance of collecting appropriate experimental data sets for training that include ribozymes with more mutations that still maintain relatively high activity. However, given the low probability of finding higher-order sequences with higher activity, an iterative approach with several cycles of predicting and testing might be necessary to acquire such data.

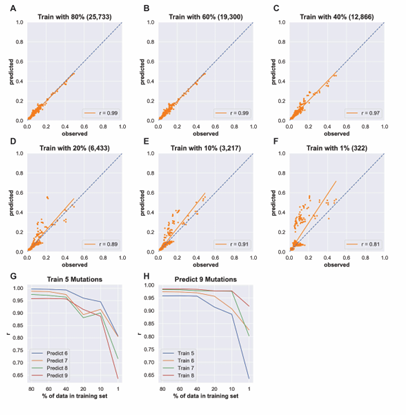
While the primary goal was to predict the relative activity of RNA sequences,
we wondered if the models might also be useful for predicting structurally important nucleotides. To address this question, we analyzed the “feature importance” in several of our Random Forest models. Feature importance is a method to assign importance to specific input data. Because our data only uses sequence as input, the features in our data are specific nucleotides (A, G, C or U) at specific positions. We found that for the Random Forest models, the most important feature all clustered around the active site of the ribozyme (Supplemental Figures 4.19). Further, the CPEB3 ribozyme uses metal ion catalysis and several of the most important features were nucleotides that have been observed coordinated to the active site magnesium ion in the CPEB3 ribozyme, or the analogous nucleotides in the structurally similar HDV ribozyme (Kapral et al., 2014; Skilandat et al., 2016). For example, for all the models trained with some higher order mutants, the most important feature was G1, which positions the cleaved phosphate bond in contact with the catalytic magnesium ion.
The second most important feature was G25, which forms a wobble base pair with U20, another important feature (top 4-6), and this nucleotide pair coordinates the active site magnesium ion through outer sphere contacts. The catalytic nucleotide C57 binds the same catalytic magnesium as the G25:U20 wobble pair, and had a high feature importance similar to U20. Most of the other important features are involved in base pairs that stack or interact with the metal ion coordinating bases. Interestingly, we found that nine of the ten most important features were identical for models trained with only single and double mutants or with increasing amounts of higher-order mutants. However, the G1 and G25 features became increasingly more important as sequences with higher mutational distance were added to the training data. This indicates that the higher-order mutants in the training data helped emphasize structurally critical nucleotides. We conclude that the machine learning models presented identified nucleotides involved in forming the active sites of the CPEB3 ribozyme. Because we did not use structural data to train our models, the results suggest that similar data could identify active sites in RNA molecules with unknown structures.
4.3 Discussion
We have shown that a model trained on ribozyme activity data can accurately predict the self-cleavage activity of sequences with numerous mutations. This approach can be used to guide experiments based on a relatively small set of initial data. Importantly, the approach did not use structural information such as X-ray crystallography or cryo-EM, and used only sequence and activity data, which can be obtained with common molecular biology approaches (in vitro transcription, RT-PCR, and sequencing). In addition, the training data starts with small amounts of synthetic DNA. The comprehensive double mutant data and the phylogenetic derived data each started from a single DNA oligo synthesis that used doped phosphoramidites at the variable positions.
Each data set was collected on a single lane of an Illumina sequencer. The approach presented in this paper is therefore accessible, rapid and inexpensive as compared to approaches that use structural data to train their models. Sequence conservation of naturally occurring RNA molecules has been another useful data type for training models to predict RNA structure from sequence (De Leonardis et al., 2015; Weinreb et al., 2016). This approach is based on the observation that nucleotide positions that form a base pair often show co-evolutionary patterns of sequence conservation. In some cases, this co-evolutionary data has been combined with thermodynamic predictions or structural data from chemical probing, such as SHAPE experiments (Calonaci et al., 2020). Numerous ribozymes, aptamers and aptazymes have been discovered through in vitro evolution experiments and conservation data is not available unless sequencing experiments were applied during the selection process. Our approach could be used to expand functional information of non-natural RNA molecules which could then be used to guide structure prediction of these molecules in a way similar to how naturally occurring sequence conservation has been used. In addition, sequence conservation does not necessarily predict relative activity. For example, while the CPEB3 ribozyme is highly conserved in nature, not all of the sequence are equally proficient at catalyzing self-cleavage (Chadalavada et al., 2010; Bendixsen et al., 2021). Our approach using machine learning from experimentally derived data may prove useful for guiding experiments with non-natural RNA molecules discovered through in vitro selection or SELEX-like approaches. However, adopting this machine learning approach will require that each experimenter acquire specific data for their system necessary to train and test sequences with the functions they are investigating.
With future work, it may be possible to produce more general models of ribozyme activity. For example, a model trained on data sets from several different self-cleaving ribozymes with different nucleotide lengths might learn to predict the activity of sequences of arbitrary length and sequence composition. In fact, recent advances in
RNA structure prediction have used the crystal structures of several different self cleaving ribozymes as training data to develop predictive modes that achieve near atomic level resolution of arbitrary sequences (Townshend et al., 2021). Alternatively, models trained on ribozymes with different activities beyond self-cleavage might be able to classify sequences as ribozymes of various functions. There has been some success with generating general models for predicting protein functions.
The latent features identified by deep generative models of protein sequences are being used to better understand the complex, higher-order amino acid interactions necessary to achieve a functional protein structure (Riesselman et al., 2018; Detlefsen et al., 2022). We hypothesize that latent features could aid in the identification of generalized parameters that govern the epistatic interactions of higher-order mutants of RNA sequences as well. We hope that the accuracy and accessibility of the approach presented here will inspire others to carry out similar experiments and initiate the data sharing that will be needed to develop more general models, similar to what is being accomplished for protein functional predictions (Biswas et al., 2021).
One challenge to our predictive models appears to be the low frequency of active sequences at higher mutational distances. In our phylogenetically derived data the vast majority of sequences have very low activity (Figure 4.1D), and the prob ability of finding sequence with high fraction cleaved decreases with the number of mutations relative to wild-type. As a consequence, models trained on lower-order mutant variants tend to overestimate the activity of sequences at higher mutational distances. It has been previously observed that experimental RNA fitness landscapes are dominated by negative epistasis, which means that mutations in combination tend to have lower fitness than would be expected from the additive effects of individual mutations (Bendixsen et al., 2017).
The overestimation of fraction cleaved at higher mutational distances suggests that our models have a difficult time learning to predict negative epistasis. It has been previously observed that mutations with “neutral” or “beneficial” effects on protein function often have destabilizing effects on protein structure (Soskine & Tawfik, 2010). We postulate that the same effect is causing negative epistasis in the RNA data. This suggests that additional information, such as measurements or estimates of thermodynamic stability of helices, might be necessary for increasing accuracy at even higher distances beyond those offered by this data set (Groher et al., 2019; Yamagami et al., 2018).
For example, we have recently demonstrated that our sequencing based approach to measuring ribozyme
activity can be extended to include magnesium titrations in order to evaluate RNA folding/stability (Peri et al., 2022). In the future, combining structural and functional information might be the best approach to accurately design RNA molecules with desired functional properties.
4.4 Materials and Methods
4.4.1 Ribozyme activity data
Ribozyme activity was determined as previously described (Bendixsen et al., 2021). Briefly, DNA templates were synthesized with the promoter for T7 RNA polymerase to enable in vitro transcription. Templates were synthesized with mixtures of phos phoramidites at variable positions. For the comprehensive double-mutant data set, templates were synthesized with 97% wild-type nucleotides and 1% each of the other three nucleotides. For the phylogenetic derived data set, the template was synthe sized with an equal mixture of the naturally occurring nucleotides that were found at 13 positions that varied across 99 mammalian genomes. During in vitro transcription, RNA molecules self-cleaved at different rates. The reaction was stopped at 30 minutes, and the RNA was concentrated and reverse transcribed with a 5’-RACE protocol that appends a new primer site to the cDNA of both cleaved and uncleaved RNA (SMARTScribe, Takara). The cDNA was PCR amplified with primers that add the adaptors for Illumina sequencing.
This procedure was done in triplicate with unique dual-indexes for each replicate. DNA was combined equimolar and sent for sequencing (GC3F, University of Oregon). Sequencing was performed on a single lane of a HiSeq 4000 using paired-end 150 reads.
4.4.2 Ribozyme activity from sequence data
FastQ sequencing data were analyzed using custom Julia and Python scripts. Briefly, the scripts identified the reverse transcription primer binding site at the 3’-end to determine nucleotide positions and then determined if the sequence was cleaved or uncleaved by the absence or presence of the 5’-upstream sequence. For the single and double mutants, all possible sequences were generated and stored in a list, and reads that matched the list elements were counted and cleaved or uncleaved was determined by the presence or absence of the 5’-upstream sequence. For the phylo genetically derived data, nucleotide identities were determined at the expected 13 variable positions by counting the string character position from the fixed regions. Sequencing reads were discarded if they contained unexpected mutations in the primer binding site, the uncleaved portion, or the ribozyme sequence. For each unique genotype in the library the number of cleaved and uncleaved sequences were counted and ribozyme activity (fraction cleaved) was calculated as fraction cleaved = counts cleaved / (counts cleaved + counts un cleaved).
4.4.3 Machine Learning
Random Forest regression uses an ensemble of decision trees to improve prediction accuracy. Each tree in the ensemble is created by partitioning the sequences within a sample into groups possessing little variation. Each sample is drawn with replacement and the resulting trees are aggregated into forests that best predict the cleavage rates of the sequences. The Random Forest regression was performed using the python package scikit-learn. Each sequence was transformed into a 69 by 4 one-hot encoding representation of the sequence. Each of the four possible nucleotides within the sequence was represented by a vector of length 4 possessing a uniquely located “1” within the vector to signify the nucleotide’s identity. Each sequence in the training set was fit using scikit-learn’s Random Forest Regressor ensemble module.
LSTM is a recurrent neural network commonly used for the predictive modeling of written text data, which has sequential dependencies. Here we used an LSTM to compute a set of hidden features given a set of nucleotide sequences. These hidden features are learned by the LSTM in a supervised way for the purpose of relating the nucleotide sequence to the corresponding ribozyme activity (fraction cleaved).
The LSTM network has an architecture where each cell C outputs the next state ht (1 ≤ t ≤ n) by taking in input from the previous state ht−1 and the embedding xt of the current nucleotide in the sequence. The output hn of the last cell of the LSTM is then used as input to a Random Forest regressor to predict the sequence functional activity rate. The LSTM model was built using PyTorch’s open-source machine learning framework. Sequences were trained using an LSTM layer with 32 hidden dimensions and a dropout rate of 0.2. Each sequence was embedded in a 69 by 4 tensor (where 4 is the size of the nucleotide embedding) and then batched in groups of 64 sequences for input to the model. The gradient descent was performed using PyTorch’s built-in Adam optimizer and MSELoss criterion. Twenty-five training epochs were performed on each training set.
4.4.4 Training and Test Data
The data set containing the fraction cleaved data from the 27,647 phylogenetically derived sequences was binned based on the number of mutations relative to the wild type ribozyme. For each bin, a portion of the data (20%) was chosen at random and set aside as test data. This resulted in test data sets that were also separated by the number of mutations relative to the wild-type sequence. Training data sets were created from the 80% of data in each mutational bin that was not set aside for testing.
Training data sets were created by combining bins at a given number of mutations to all the bins with lower numbers of mutations. Training data included 100% of the single and double mutant data. For reduced training sets were created by randomly sampling different numbers of sequences from the original full training data sets.
4.4.5 Data Availability
Sequencing reads in FastQ format are available at ENA (PRJEB51631). Sequence and activity data and computer code is available at GitLab (https://gitlab.com/ bsu/biocompute-public/ml-ribo-predict.git).
4.4.6 Author Contributions
JB– involved in conceptualizing the project, managed data, performed computational work for formal analysis and visualization, reviewed and edited the manuscript; JR– involved in conceptualizing the project, performed experiments, managed the project, supervised and facilitated computational work, prepared figures, reviewed and edited the manuscript, JK– involved in conceptualizing the project, performed computational work for formal analysis and validation; AT– was involved in concep tualizing the project, helped with experimental validation, supervised and facilitated computational work; ES– Involved in conceptualizing the project, supervised compu
tational work, reviewed and edited the manuscript; FS– Involved in conceptualizing the project, supervised computational work, reviewed and edited the manuscript; EH– involved in conceptualizing the project, supervised experimental work, supervised computational work, wrote the original draft, and reviewed and edited the manuscript.
4.4.7 Funding
The authors acknowledge funding from the National Science Foundation (EH, grant number OIA-1738865, OIA-1826801, REU site grant #1950599), National Aeronautics and Space Administration (EH, grant number 80NSSC17K0738), and the Human Frontier Science Program (EH, Ref.-No: RGY0077/2019).
4.4.8 Acknowledgments
We thank Devin Bendixsen for producing the fitness landscape image used in the manuscript and for valuable discussions.
4.4.9 Supplementary Materials

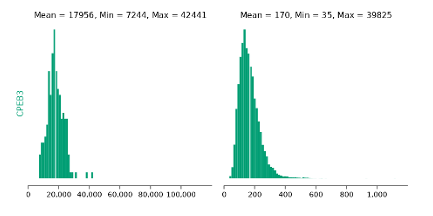
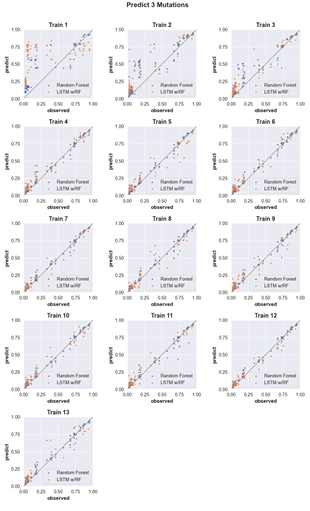

Figure 4.6: Three-mutation sequence activity predictions. Scatter plots comparing fraction cleaved values measured from experiments (observed) to those predicted by models (predict) trained by either random forest (blue) or the LSTM approach (orange). Each scatter plot shows the predictions from a different training data set. The training data contained sequences with up to the number of mutations in the title (Train N). For example, ‘Train 5’ indicates that the model was trained using data for sequences containing 1,2,3,4, and 5 mutations. The line indicates unity, not a fit to the data.

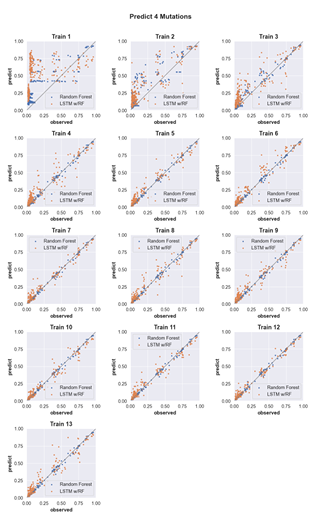

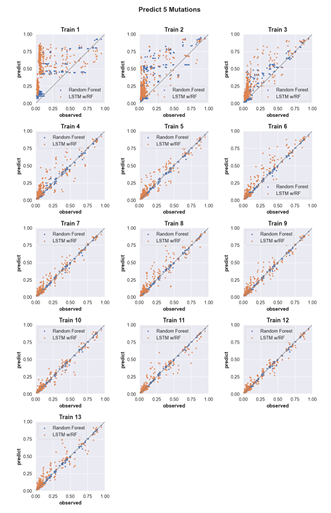

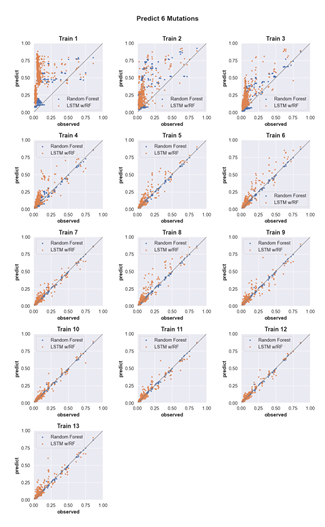

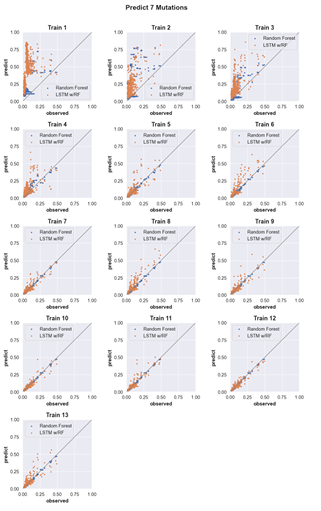

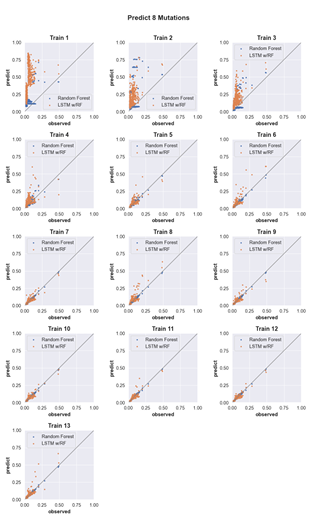

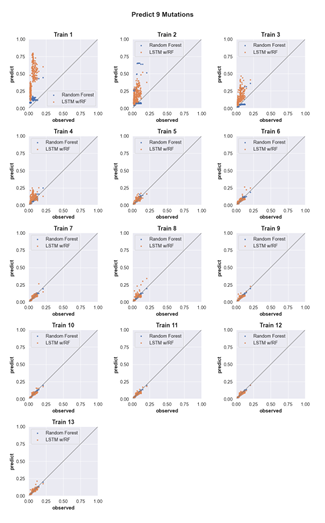

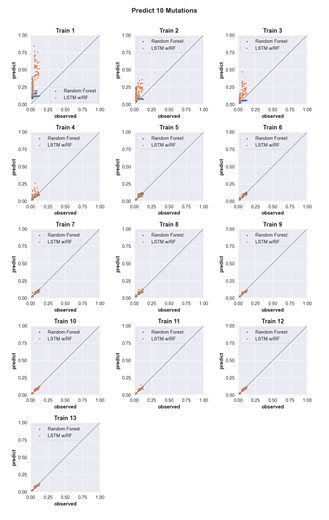

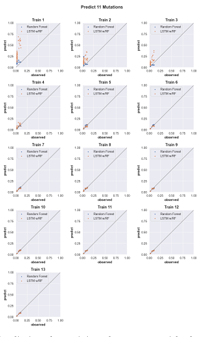

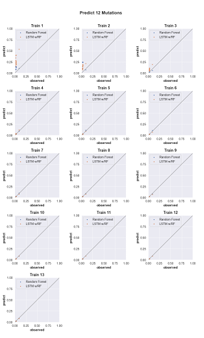
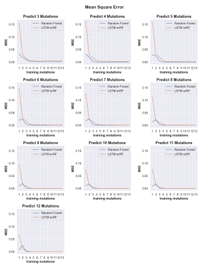

Figure 4.16: Line plots showing the mean square error (MSE) of predicted cleavage activity values obtained from random forest (blue) and LSTM with random forest (orange) machine learning models trained on data with incrementally increasing numbers of mutations shown along the x axis. Each plot shows the MSE for predictions obtained for sequences containing the number of mutations indicated by the plot title.
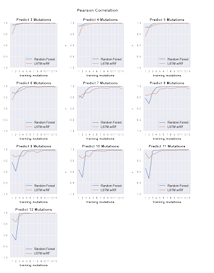

Figure 4.17: Line plots showing the Pearson correlation values of predicted cleavage activity obtained from random forest (blue) and LSTM with ran dom forest (orange) machine learning models trained on data with incre
mentally increasing numbers of mutations shown along the x-axis. Each plot shows the Pearson correlation for predictions obtained for sequences containing the number of mutations indicated by the plot title.
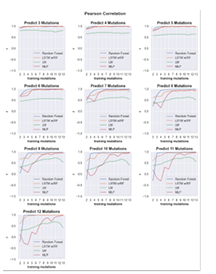

Figure 4.18: Benchmarking against several ML approaches. Line plots showing the Pearson correlation values of predicted cleavage activity obtained from random forest (blue), LSTM with random forest (orange), linear regression (green) and multilayer perceptron regressor (red) machine learning models trained on data with incrementally increasing numbers of mutations shown along the x-axis. Each plot shows the Pearson cor relation for predictions obtained for sequences containing the number of mutations indicated by the plot title.
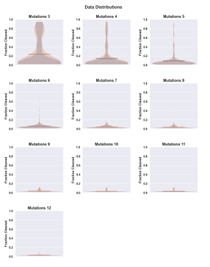

Figure 4.19: Violin plots showing the distribution of cleavage rates ob served in the test data (orange) and the total data set for a given mutation (blue). The distributions are shown separately for each data set containing increasing numbers of mutations, from 3 to 12.
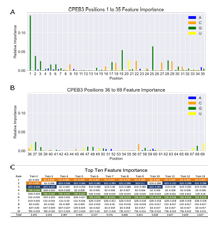

Figure 4.20: Summary of important features extracted from random forest models. A-B) Bar graphs of feature importance when training with up to five mutations. Each feature represents a specific nucleotide at a specific location, as indicated by the X-axis label (position), and color (nucleotide identity). Positions 1-35 are shown in (A), and positions 36-69 are shown in (B). The height of the bar indicates the relative importance. C) Table ranking the top ten important features extracted from random forest models trained with increasing numbers of mutations. Nucleotides discussed in the main text are highlighted.
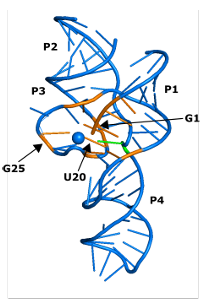

Figure 4.21: Crystal structure of an HDV ribozyme (PDB 3NKB) showing the CPEB3 analogous positions representing the top ten important features identified in our random forest models. The feature importance depicted was extracted from the random forest model trained on CPEB3 data including up to 5 mutations. The nucleotides identified as the top ten important features are shaded in orange, the catalytic nucleotide is
shaded green (C57/75), and the catalytic Mg2+ ion is depicted as a blue sphere.
Train with% Pearson Spearman
80% 0.99 0.81
60% 0.99 0.80
40% 0.97 0.79
20% 0.89 0.80
10% 0.91 0.77
1% 0.81 0.71
Table 4.2: Table comparing Pearson and Spear man correlation metrics for reduced training sets containing sequences with up to 5 mutations predicting sequences with 7 mutations. Both Pearson and Spearman correlations show similar, limited reductions in correlation as training set size is reduced.
Predict Mutations LS T M w/ RF Pearson RF Pearson LSTMw/RFSpearman RFSpearman
3 0.9 0.93 0.80 0.78
4 0.85 0.9 0.60 0.81
5 0.77 0.82 0.52 0.82
6 0.7 0.68 0.51 0.74
7 0.63 0.48 0.44 0.7
8 0.61 0.22 0.46 0.64
9 0.67 0.02 0.50 0.63
10 0.6 -0.24 0.45 0.51
11 0.6 -0.3 0.48 0.37
Table 4.3: Table comparing Pearson and Spear man correlation metrics for training set containing sequences with up to 2 mutations predicting sequences with 3 to 11 mutations using the LSTM with Random Forest and the Random Forest models. Both Pearson and Spear man correlations show similar reductions in correlation as predictive distance grows.
REFERENCES
Andreasson, Johan O. L., Savinov, Andrew, Block, Steven M., & Greenleaf, William J. 2020. Comprehensive sequence-to-function mapping of cofactor dependent RNA catalysis in the glmS ribozyme. Nature Communications, 11(1), 1663.
Athavale, Shreyas S, Spicer, Brad, & Chen, Irene A. 2014. Experimental fitness land scapes to understand the molecular evolution of RNA-based life. Current Opinion in Chemical Biology, 22(Oct.), 35–39.
Bak, Rasmus O., Gomez-Ospina, Natalia, & Porteus, Matthew H. 2018. Gene Editing on Center Stage. Trends in Genetics, 34(8), 600–611.
Beck, James D., Roberts, Jessica M., Kitzhaber, Joey M., Trapp, Ashlyn, Serra, Edoardo, Spezzano, Francesca, & Hayden, Eric J. 2022. Predicting higher-order mutational effects in an RNA enzyme by machine learning of high-throughput experimental data. Frontiers in Molecular Biosciences, 9(Aug.), 893864.
Bendixsen, Devin P., Østman, Bjørn, & Hayden, Eric J. 2017. Negative Epistasis in Experimental RNA Fitness Landscapes. Journal of Molecular Evolution, 85(5-6), 159–168.
Bendixsen, Devin P., Collet, James, Østman, Bjørn, & Hayden, Eric J. 2019. Geno- type network intersections promote evolutionary innovation. PLOS Biology, 17(5), e3000300.
Bendixsen, Devin P., Pollock, Tanner B., Peri, Gianluca, & Hayden, Eric J. 2021. Experimental Resurrection of Ancestral Mammalian CPEB3 Ribozymes Reveals Deep Functional Conservation. Molecular Biology and Evolution, 38(7), 2843–2853.
Berman, H., Henrick, K., Nakamura, H., & Markley, J. L. 2007. The worldwide Protein Data Bank (wwPDB): ensuring a single, uniform archive of PDB data. Nucleic Acids Research, 35(Database), D301–D303.
Biswas, Surojit, Khimulya, Grigory, Alley, Ethan C., Esvelt, Kevin M., & Church, George M. 2021. Low-N protein engineering with data-efficient deep learning. Nature Methods, 18(4), 389–396.
Blanco, Celia, Janzen, Evan, Pressman, Abe, Saha, Ranajay, & Chen, Irene A. 2019. Molecular Fitness Landscapes from High-Coverage Sequence Profiling. Annual Re view of Biophysics, 48(1), 1–18.
Burke, Donald H, & Greathouse, S Travis. 2005. Low-magnesium, trans-cleavage activity by type III, tertiary stabilized hammerhead ribozymes with stem 1 discontinuities. BMC Biochemistry, 6(1), 14.
Calonaci, Nicola, Jones, Alisha, Cuturello, Francesca, Sattler, Michael, & Bussi, Giovanni. 2020. Machine learning a model for RNA structure prediction. NAR Ge nomics and Bioinformatics, 2(4), lqaa090.
Chadalavada, Durga M., Cerrone-Szakal, Andrea L., & Bevilacqua, Philip C. 2007.
Wild-type is the optimal sequence of the HDV ribozyme under cotranscriptional conditions. RNA, 13(12), 2189–2201.
Chadalavada, Durga M., Gratton, Elizabeth A., & Bevilacqua, Philip C. 2010. The Human HDV-like CPEB3 Ribozyme Is Intrinsically Fast-Reacting. Biochemistry, 49(25), 5321–5330.
Chang, Tzu-Hao, Huang, Hsi-Yuan, Hsu, Justin Bo-Kai, Weng, Shun-Long, Horng, Jorng-Tzong, & Huang, Hsien-Da. 2013. An enhanced computational platform for investigating the roles of regulatory RNA and for identifying functional RNA motifs. BMC Bioinformatics, 14(S2), S4.
Chi, Young-In, Martick, Monika, Lares, Monica, Kim, Rosalind, Scott, William G, & Kim, Sung-Hou. 2008. Capturing Hammerhead Ribozyme Structures in Action by Modulating General Base Catalysis. PLoS Biology, 6(9), e234.
Detlefsen, Nicki Skafte, Hauberg, Søren, & Boomsma, Wouter. 2022. Learning meaningful representations of protein sequences. Nature Communications, 13(1), 1914.
De Leonardis, Eleonora, Lutz, Benjamin, Ratz, Sebastian, Cocco, Simona, Mon as son, R´ emi, Schug, Alexander, & Weigt, Martin. 2015. Direct-Coupling Analysis of nucleotide coevolution facilitates RNA secondary and tertiary structure prediction. Nucleic Acids Research, Sept., gkv932.
Doudna, Jennifer A. 1995. Hammerhead ribozyme structure: U-turn for RNA structural biology. Structure, 3(8), 747–750. Dutheil, Julien Y., Jossinet, Fabrice, & Westhof, Eric. 2010. Base Pairing Constraints Drive Structural Epistasis in Ribosomal RNA Sequences. Molecular Biology and Evolution, 27(8), 1868–1876.
Dykstra, Peter B., Kaplan, Matias, & Smolke, Christina D. 2022. Engineering synthetic RNA devices for cell control. Nature Reviews Genetics, 23(4), 215–228.
Fedor, Martha J. 2000. Structure and function of the hairpin ribozyme. Journal of Molecular Biology, 297(2), 269–291.
Fedor, Martha J., & Williamson, James R. 2005. The catalytic diversity of RNAs. Nature Reviews Molecular Cell Biology, 6(5), 399–412.
Ferre-D’Amare, A. R., & Scott, W. G. 2010. Small Self-cleaving Ribozymes. Cold Spring Harbor Perspectives in Biology, 2(10), a003574–a003574.
Ferretti, Luca, Weinreich, Daniel, Tajima, Fumio, & Achaz, Guillaume. 2018. Evolutionary constraints in fitness landscapes. Heredity, 121(5), 466–481.
Geisler, Sarah, & Coller, Jeff. 2013. RNA in unexpected places: long non-coding RNAfunctions in diverse cellular contexts. Nature Reviews Molecular Cell Biology, 14(11), 699–712.
Groher, Ann-Christin, Jager, Sven, Schneider, Christopher, Groher, Florian, Hamacher, Kay, & Suess, Beatrix. 2019. Tuning the Performance of Synthetic Riboswitches using Machine Learning. ACS Synthetic Biology, 8(1), 34–44.
Groher, Florian, & Suess, Beatrix. 2014. Synthetic riboswitches — A tool comes of age. Biochimica et Biophysica Acta (BBA)- Gene Regulatory Mechanisms, 1839(10), 964–973.
Gupta, Sanjeev K., & Shukla, Pratyoosh. 2017. Gene editing for cell engineering: trends and applications. Critical Reviews in Biotechnology, 37(5), 672–684.
Halvorsen, Matthew, Martin, Joshua S., Broadaway, Sam, & Laederach, Alain. 2010. Disease-Associated Mutations That Alter the RNA Structural Ensemble. PLoS Genetics, 6(8), e1001074.
Hayden, Eric J. 2016. Empirical analysis of RNA robustness and evolution using high-throughput sequencing of ribozyme reactions. Methods, 106(Aug.), 97–104.
Huppertz, Ina, Perez-Perri, Joel I., Mantas, Panagiotis, Sekaran, Thileepan, Schwarzl, Thomas, Russo, Francesco, Ferring-Appel, Dunja, Koskova, Zuzana, Dimitrova Paternoga, Lyudmila, Kafkia, Eleni, Hennig, Janosch, Neveu, Pierre A., Patil, Kiran, & Hentze, Matthias W. 2022. Riboregulation of Enolase 1 activity con trols glycolysis and embryonic stem cell differentiation. Molecular Cell, June, S1097276522004865.
Jimenez, Randi M., Polanco, Julio A., & Lupt´ak, Andrej. 2015. Chemistry and Biology of Self-Cleaving Ribozymes. Trends in Biochemical Sciences, 40(11), 648661.
Jumper, John, Evans, Richard, Pritzel, Alexander, Green, Tim, Figurnov, Michael, Ronneberger, Olaf, Tunyasuvunakool, Kathryn, Bates, Russ, ˇ Z´ ıdek, Augustin, Potapenko, Anna, Bridgland, Alex, Meyer, Clemens, Kohl, Simon A. A., Ballard, Andrew J., Cowie, Andrew, Romera-Paredes, Bernardino, Nikolov, Stanislav, Jain, Rishub, Adler, Jonas, Back, Trevor, Petersen, Stig, Reiman, David, Clancy, Ellen, Zielinski, Michal, Steinegger, Martin, Pacholska, Michalina, Berghammer,
Tamas, Bodenstein, Sebastian, Silver, David, Vinyals, Oriol, Senior, Andrew W., Kavukcuoglu, Koray, Kohli, Pushmeet, & Hassabis, Demis. 2021. Highly accurate protein structure prediction with AlphaFold. Nature, 596(7873), 583–589.
Kapral, Gary J., Jain, Swati, Noeske, Jonas, Doudna, Jennifer A., Richardson, David C., & Richardson, Jane S. 2014. New tools provide a second look at HDV ribozyme structure, dynamics and cleavage. Nucleic Acids Research, 42(20), 12833 12846.
Kobori, Shungo, & Yokobayashi, Yohei. 2016. High-Throughput Mutational Analysis of a Twister Ribozyme. Angewandte Chemie International Edition, 55(35), 1035410357.
Kobori, Shungo, Nomura, Yoko, Miu, Anh, & Yokobayashi, Yohei. 2015. High throughput assay and engineering of self-cleaving ribozymes by sequencing. Nucleic Acids Research, 43(13), e85–e85.
Kobori, Shungo, Takahashi, Kei, & Yokobayashi, Yohei. 2017. Deep Sequencing Analysis of Aptazyme Variants Based on a Pistol Ribozyme. ACS Synthetic Biology, 6(7), 1283–1288.
Levy, Shawn E., & Boone, Braden E. 2019. Next-Generation Sequencing Strategies. Cold Spring Harbor Perspectives in Medicine, 9(7), a025791.
Li, Chuan, Qian, Wenfeng, Maclean, Calum J., & Zhang, Jianzhi. 2016. The fitness landscape of a tRNA gene. Science, 352(6287), 837–840.
Liang, Joe C., Bloom, Ryan J., & Smolke, Christina D. 2011. Engineering Biological Systems with Synthetic RNA Molecules. Molecular Cell, 43(6), 915–926.
Liu, Yijin, Wilson, Timothy J, McPhee, Scott A, & Lilley, David M J. 2014. Crystal structure and mechanistic investigation of the twister ribozyme. Nature Chemical Biology, 10(9), 739–744.
Mao, Yanfei, Botella, Jose Ramon, Liu, Yaoguang, & Zhu, Jian-Kang. 2019. Gene editing in plants: progress and challenges. National Science Review, 6(3), 421–437.
Martick, Monika, & Scott, William G. 2006. Tertiary Contacts Distant from the Active Site Prime a Ribozyme for Catalysis. Cell, 126(2), 309–320.
M¨ uller, Sabine, Appel, Bettina, Krellenberg, Tobias, & Petkovic, Sonja. 2012. The many faces of the hairpin ribozyme: Structural and functional variants of a small catalytic rna. IUBMB Life, 64(1), 36–47.
Nakano, Shu-ichi, Chadalavada, Durga M., & Bevilacqua, Philip C. 2000. General Acid-Base Catalysis in the Mechanism of a Hepatitis Delta Virus Ribozyme. Sci ence, 287(5457), 1493–1497.
Olson, C. Anders, Wu, Nicholas C., & Sun, Ren. 2014. A Comprehensive Biophysical Description of Pairwise Epistasis throughout an Entire Protein Domain. Current Biology, 24(22), 2643–2651.
Peng, Huan, Latifi, Brandon, M¨ uller, Sabine, Lupt´ ak, Andrej, & Chen, Irene A. 2021. Self-cleaving ribozymes: substrate specificity and synthetic biology applications. RSC Chemical Biology, 2(5), 1370–1383.
Peri, Gianluca, Gibard, Cl´ ementine, Shults, Nicholas H, Crossin, Kent, & Hayden, Eric J. 2022. Dynamic RNA Fitness Landscapes of a Group I Ribozyme during Changes to the Experimental Environment. Molecular Biology and Evolution, 39(3), msab373.
Perreault, Jonathan, Weinberg, Zasha, Roth, Adam, Popescu, Olivia, Chartrand, Pascal, Ferbeyre, Gerardo, & Breaker, Ronald R. 2011. Identification of Hammer head Ribozymes in All Domains of Life Reveals Novel Structural Variations. PLoS Computational Biology, 7(5), e1002031.
Premkumar, Keshav Aditya R., Bharanikumar, Ramit, & Palaniappan, Ashok. 2020. Riboflow: Using Deep Learning to Classify Riboswitches With 99% Accuracy. Fron tiers in Bioengineering and Biotechnology, 8(July), 808.
Pressman, Abe D., Liu, Ziwei, Janzen, Evan, Blanco, Celia, M¨uller, Ulrich F., Joyce, Gerald F., Pascal, Robert, & Chen, Irene A. 2019. Mapping a Systematic Ribozyme Fitness Landscape Reveals a Frustrated Evolutionary Network for Self Aminoacylating RNA. Journal of the American Chemical Society, 141(15), 62136223.
Prody, Gerry A., Bakos, John T., Buzayan, Jamal M., Schneider, Irving R., & Bruening, George. 1986. Autolytic Processing of Dimeric Plant Virus Satellite RNA. Science, 231(4745), 1577–1580.
Riesselman, Adam J., Ingraham, John B., & Marks, Debora S. 2018. Deep generative models of genetic variation capture the effects of mutations. Nature Methods,15(10), 816–822.
Roberts, Jessica M., Beck, James D., Pollock, Tanner B., Bendixsen, Devin P., & Hayden, Eric J. 2022 (May). RNA sequence to structure analysis from comprehensive pairwise mutagenesis of multiple self-cleaving ribozymes. preprint. Molecular Biology
Roth, Adam, Weinberg, Zasha, Chen, Andy G Y, Kim, Peter B, Ames, Tyler D, & Breaker, Ronald R. 2014. A widespread self-cleaving ribozyme class is revealed by bioinformatics. Nature Chemical Biology, 10(1), 56–60.
Rother, Kristian, Rother, Magdalena, Boniecki, Michal, Puton, Tomasz, & Bujnicki, Janusz M. 2011. RNA and protein 3D structure modeling: similarities and differ ences. Journal of Molecular Modeling, 17(9), 2325–2336.
Rupert, Peter B., & Ferr´ e-D’Amar´ e, Adrian R. 2001. Crystal structure of a hairpin ribozyme–inhibitor complex with implications for catalysis. Nature, 410(6830), 780–786.
Salehi-Ashtiani, Kourosh, Lupt´ ak, Andrej, Litovchick, Alexander, & Szostak, Jack W. 2006. A Genomewide Search for Ribozymes Reveals an HDV-Like Sequence in the Human CPEB3 Gene. Science, 313(5794), 1788–1792.
Schmidt, Calvin M, & Smolke, Christina D. 2021. A convolutional neural network for the prediction and forward design of ribozyme-based gene-control elements. eLife, 10(Apr.), e59697.
Scott, William G., Horan, Lucas H., & Martick, Monika. 2013. The Hammerhead Ribozyme. Pages 1–23 of: Progress in Molecular Biology and Translational Science, vol. 120. Elsevier.
Shen, Yuning, Pressman, Abe, Janzen, Evan, & Chen, Irene A. 2021. Kinetic sequencing (k-Seq) as a massively parallel assay for ribozyme kinetics: utility and critical parameters. Nucleic Acids Research, 49(12), e67–e67.
Skilandat, Miriam, Rowinska-Zyrek, Magdalena, & Sigel, Roland K.O. 2016. Secondary structure confirmation and localization of Mg 2+ ions in the mammalian CPEB3 ribozyme. RNA, 22(5), 750–763.
Soskine, Misha, & Tawfik, Dan S. 2010. Mutational effects and the evolution of new protein functions. Nature Reviews Genetics, 11(8), 572–582.
Stifel, Julia, Sp¨oring, Maike, & Hartig, J¨ org Steffen. 2019. Expanding the toolbox of synthetic riboswitches with guanine-dependent aptazymes. Synthetic Biology, 4(1), ysy022.
Szendro, Ivan G, Schenk, Martijn F, Franke, Jasper, Krug, Joachim, & de Visser, J Arjan G M. 2013. Quantitative analyses of empirical fitness landscapes. Journal of Statistical Mechanics: Theory and Experiment, 2013(01), P01005.
Townshend, Brent, Kennedy, Andrew B, Xiang, Joy S, & Smolke, Christina D. 2015. High-throughput cellular RNA device engineering. Nature Methods, 12(10), 989994.
Townshend, Raphael J. L., Eismann, Stephan, Watkins, Andrew M., Rangan, Ramya, Karelina, Maria, Das, Rhiju, & Dror, Ron O. 2021. Geometric deep learning of RNA structure. Science, 373(6558), 1047–1051.
Walter, Nils G, Yang, Ning, & Burke, John M. 2000. Probing non-selective cation binding in the hairpin ribozyme with Tb(III). Journal of Molecular Biology, 298(3), 539–555.
Watkins, Andrew M., Geniesse, Caleb, Kladwang, Wipapat, Zakrevsky, Paul, Jaeger, Luc, & Das, Rhiju. 2018. Blind prediction of noncanonical RNA structure at atomic accuracy. Science Advances, 4(5), eaar5316.
Wei, Kathy Y., & Smolke, Christina D. 2015. Engineering dynamic cell cycle control with synthetic small molecule-responsive RNA devices. Journal of Biological Engineering, 9(1), 21.
Weinreb, Caleb, Riesselman, Adam J., Ingraham, John B., Gross, Torsten, Sander, Chris, & Marks, Debora S. 2016. 3D RNA and Functional Interactions from Evolutionary Couplings. Cell, 165(4), 963–975.
Wilson, Timothy J., Ouellet, Jonathan, Zhao, Zheng-Yun, Harusawa, Shinya, Araki, Lisa, Kurihara, Takushi, & Lilley, David M.J. 2006. Nucleobase catalysis in the hairpin ribozyme. RNA, 12(6), 980–987.
Wilson, Timothy J., Liu, Yijin, Domnick, Christof, Kath-Schorr, Stephanie, & Lilley, David M. J. 2016. The Novel Chemical Mechanism of the Twister Ribozyme. Journal of the American Chemical Society, 138(19), 6151–6162.
wwPDB consortium, Burley, Stephen K, Berman, Helen M, Bhikadiya, Charmi, Bi, Chunxiao, Chen, Li, Costanzo, Luigi Di, Christie, Cole, Duarte, Jose M, Dutta, Shuchismita, Feng, Zukang, Ghosh, Sutapa, Goodsell, David S, Green, Rachel Kramer, Guranovic, Vladimir, Guzenko, Dmytro, Hudson, Brian P, Liang, Yuhe, Lowe, Robert, Peisach, Ezra, Periskova, Irina, Randle, Chris, Rose, Alexander, Sekharan, Monica, Shao, Chenghua, Tao, Yi-Ping, Valasatava, Yana, Voigt, Maria, Westbrook, John, Young, Jasmine, Zardecki, Christine, Zhuravleva, Marina, Kurisu, Genji, Nakamura, Haruki, Kengaku, Yumiko, Cho, Hasumi, Sato Junko, Kim, Ju Yaen, Ikegawa, Yasuyo, Nakagawa, Atsushi, Yamashita, Reiko, Kudou, Takahiro, Bekker, Gert-Jan, Suzuki, Hirofumi, Iwata, Takeshi, Yokochi, Masashi, Kobayashi, Naohiro, Fujiwara, Toshimichi, Velankar, Sameer, Kleywegt, Gerard J, Anyango, Stephen, Armstrong, David R, Berrisford, John M, Conroy, Matthew J, Dana, Jose M, Deshpande, Mandar, Gane, Paul, G´ aborov´a, Romana, Gupta, Deepti, Gutmanas, Aleksandras, Koˇ ca, Jaroslav, Mak, Lora, Mir, Saqib, Mukhopadhyay, Abhik, Nadzirin, Nurul, Nair, Sreenath, Patwardhan, Ardan, Paysan-Lafosse, Typhaine, Pravda, Lukas, Salih, Osman, Sehnal, David, Varadi, Mihaly, Vaˇ rekov´a, Radka, Markley, John L, Hoch, Jeffrey C, Romero, Pedro R, Baskaran, Kumaran, Maziuk, Dimitri, Ulrich, Eldon L, Wedell, Jonathan R, Yao, Hongyang, Livny, Miron, & Ioannidis, Yannis E. 2019. Protein Data Bank: the single global archive for 3D macromolecular structure data. Nucleic Acids Research, 47(D1), D520–D528.


